Monitor
GMPT, October 2024
The monitors in Macondo are tools used to observe and record various physical quantities and performance parameters during the simulation process. Their main functions include:
1)Performance Analysis: Monitors can be used to track the performance parameters of optical device simulation models. This may include transmitted light intensity, reflectivity, transmittance, electric field distribution, magnetic field distribution, mode distribution, and more. By monitoring these parameters during the simulation, users can gain real-time insights into device performance, helping to optimize designs. 2)Data Logging: Monitors can record the data collected during the simulation for further analysis. This is useful for generating performance curves, developing experimental plans, and comparing with experimental results.
3)Data Visualization: Visualization tools allow users to graphically view the data captured by monitors, such as plotting light intensity distribution, refractive index distribution, spectra, etc. This helps provide a more intuitive understanding of the simulation results.
In the Macondo, the monitors mainly include:
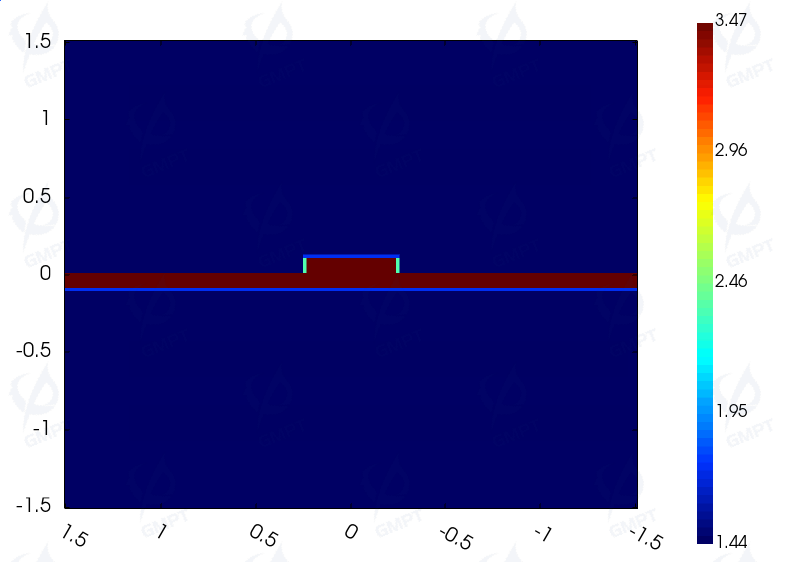
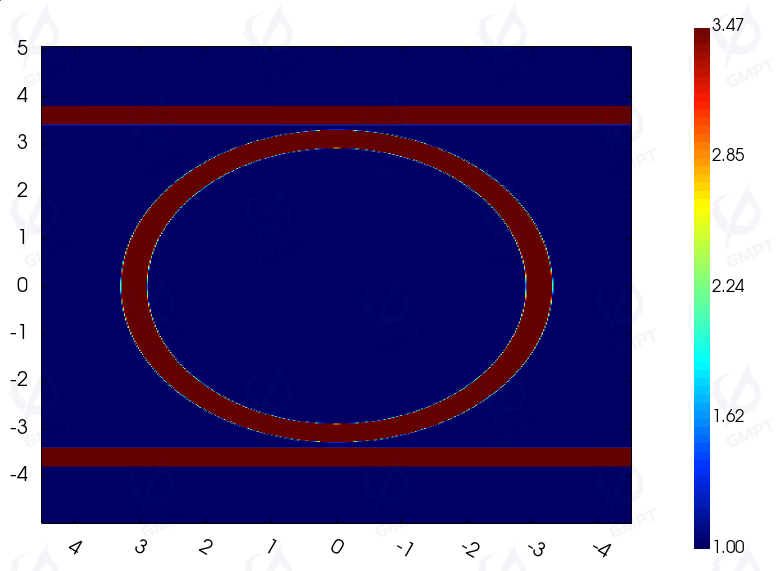
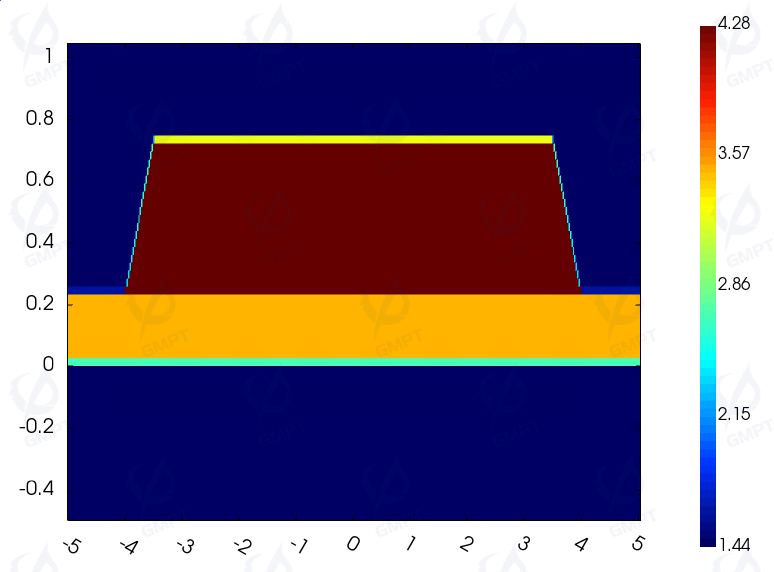
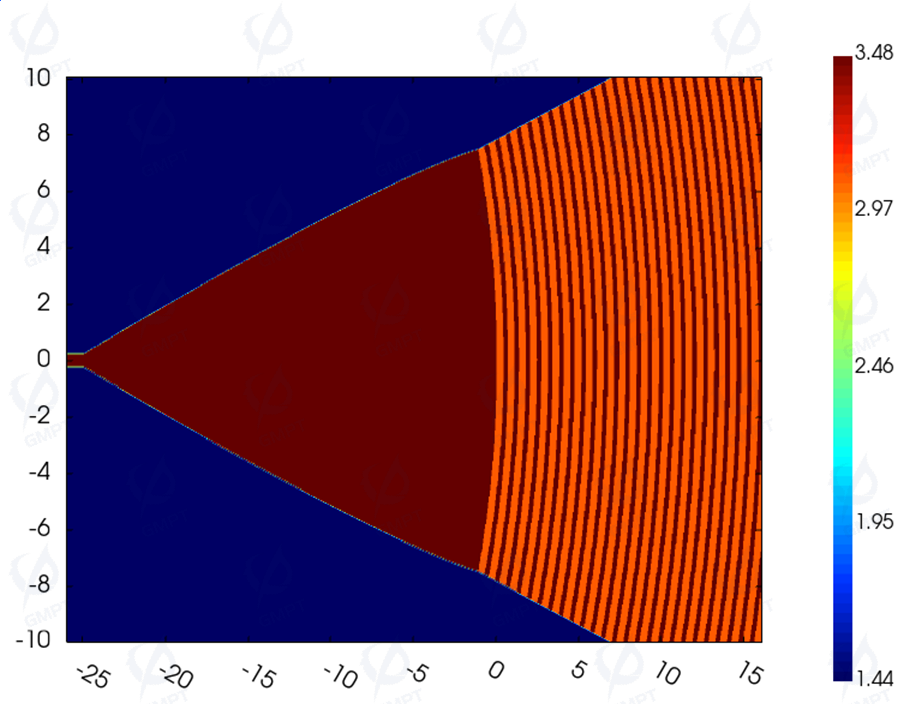
- Refractive Index Monitor: Spatial distribution of material refractive index.
- Refractive index distribution of different devices (ridge waveguide, multimode interference coupler, microring resonator, Y-splitter/combiner).
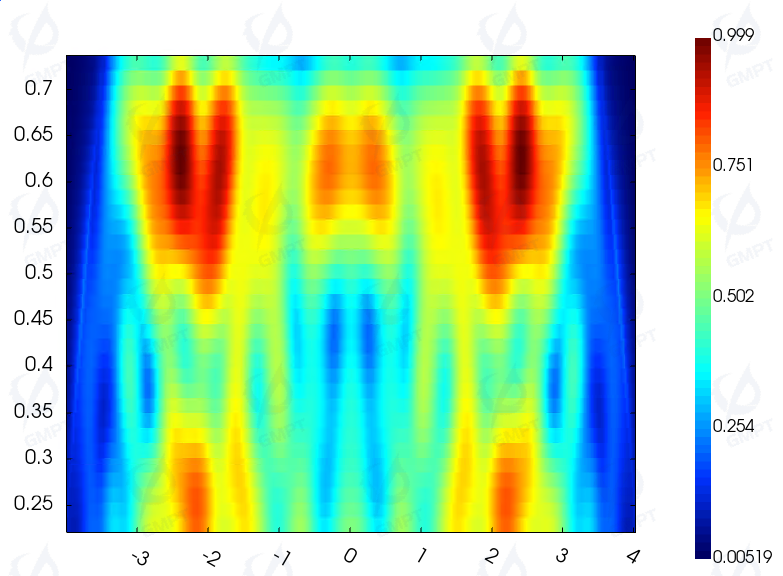
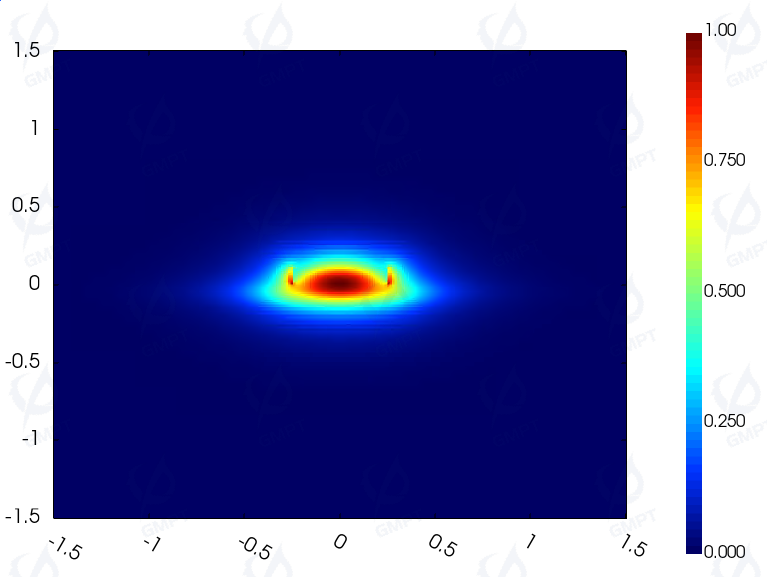
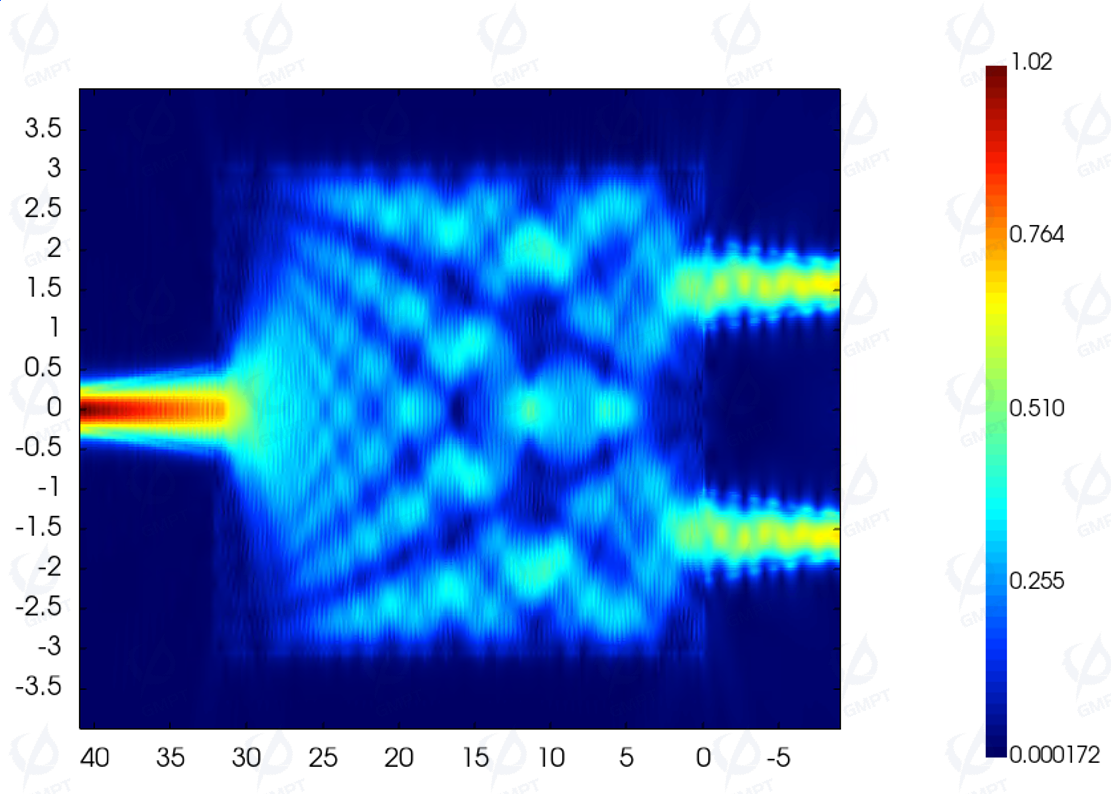
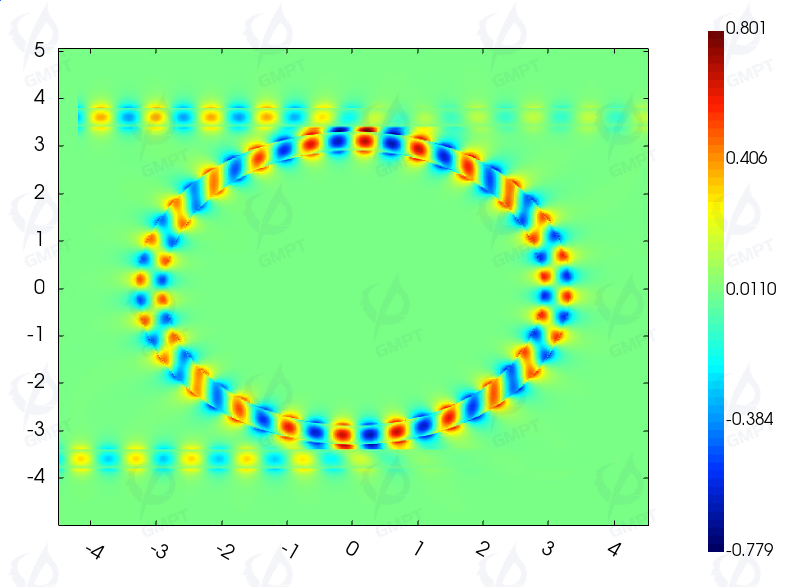
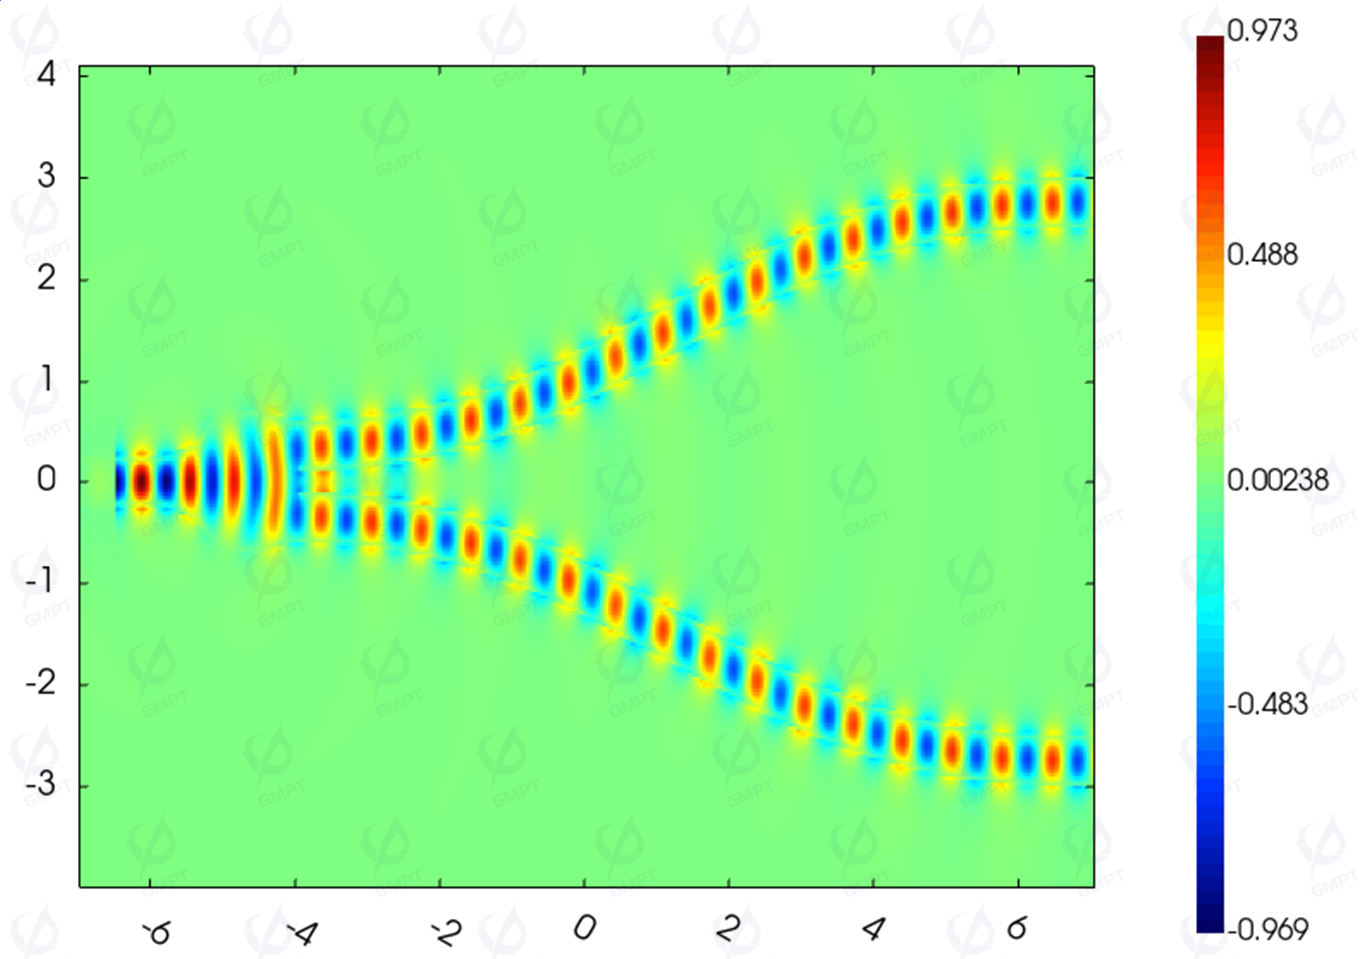
- Fourier Field Distribution Monitor: Spatial distribution of the electric field and magnetic field at each frequency point after the Fourier transform.
- Field distribution of different devices (ridge waveguide, microring resonator, photodetector, grating coupler).
- Time Monitor: Electric field and magnetic field variations over time.
- Time-varying electric and magnetic field curves:
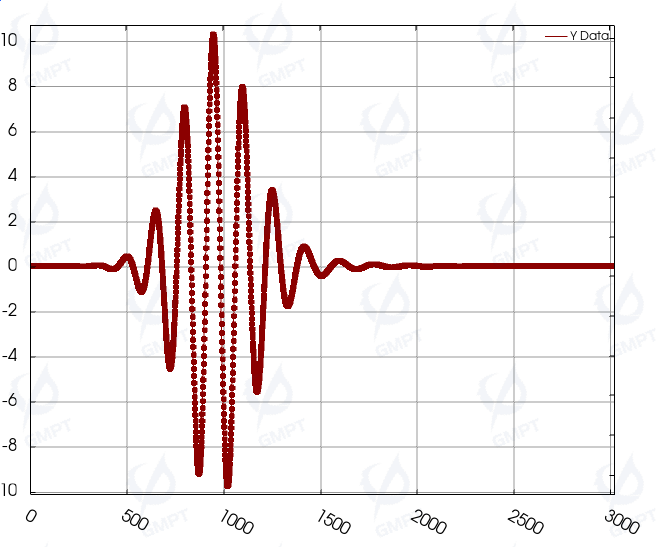
- Time-varying electric and magnetic field curves:
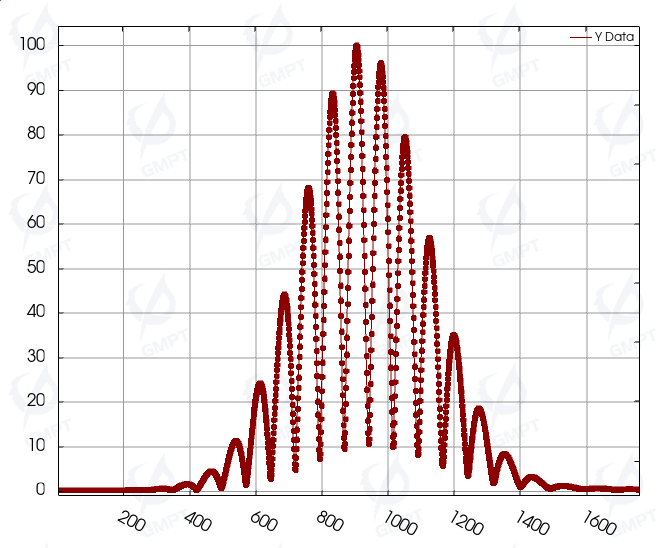
- Transmission/Reflection Monitor: Monitors the transmission and reflection spectra of the optical field at a cross-section
- Transmission/Reflection spectra of the optical field at a cross-section (HalfRing):
- Transmission/Reflection spectra of the optical field at a cross-section (HalfRing):
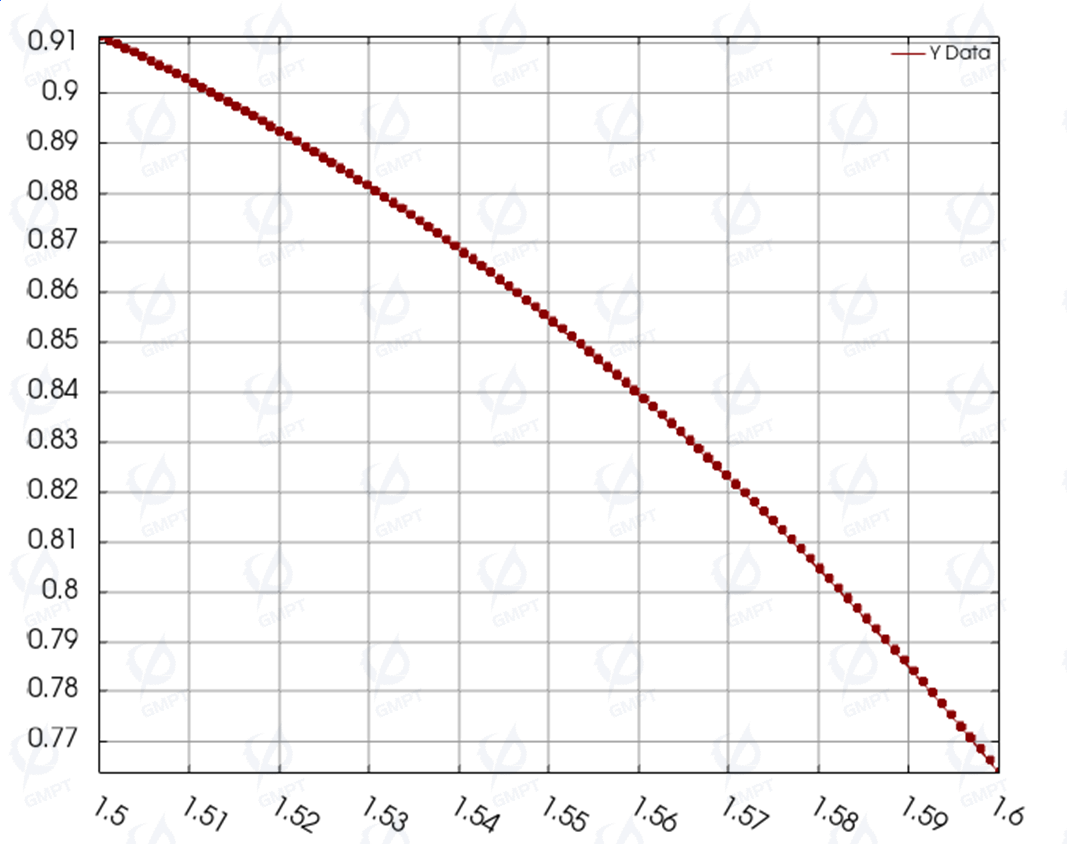
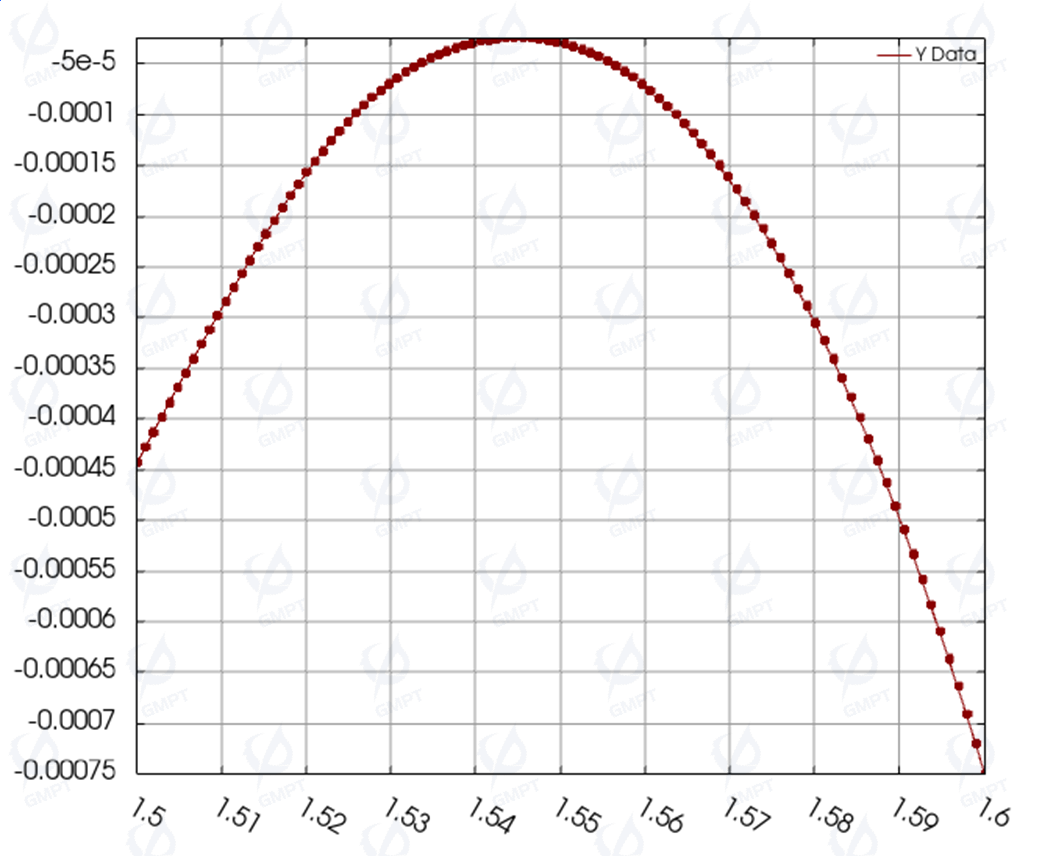
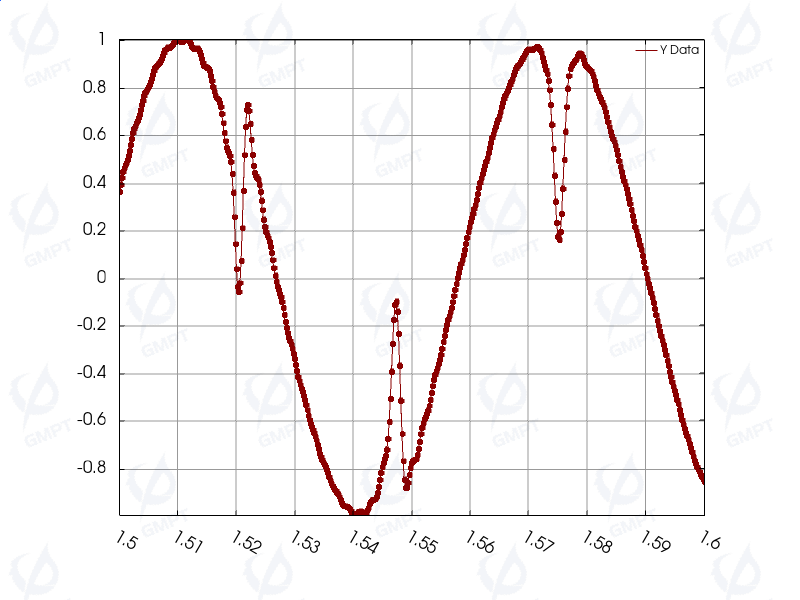
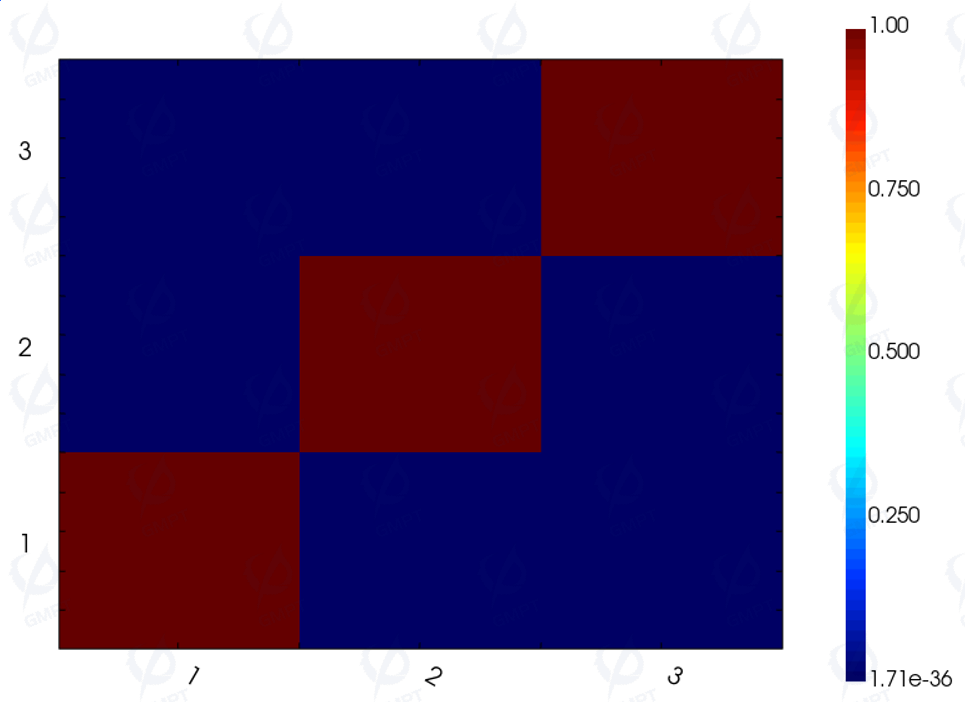
- Port S-Parameter Monitor: S-parameters of the light source input port and each output port.
- Port S-Parameter curves in FDTD (MicroRing)
- Port S-Parameter matrix in EME (WaveGuide)
- *Far-Field Monitor: Monitors the far-field distribution in a hemispherical region
- Extract the combined output results of each monitor through Python scripts, such as the photo-generated carrier rate required by the detector, and perform optoelectronic co-simulation in conjunction with Nuwa TCAD.
- Cross-sectional field distribution of the photodetector