Simulating Quadrant Photodetector Using Rayzen Software
1. Introduction
Laser guidance technology represents a high-precision method for directing various platforms to their intended targets, holding significant military importance in contemporary national security strategies. This technology typically encompasses the following stages:
Laser Emission: A laser beam is emitted from a laser source and directed toward the target. The precision of this emission is critical for ensuring accurate guidance.
Signal Detection and Processing: Upon reaching the target or its vicinity, the laser undergoes diffuse reflection. A platform equipped with a laser detector captures this reflected signal. Among the available detection technologies, the four-quadrant photodetector stands out for its superior performance characteristics.
Guidance Control: The detected laser signal is analyzed and processed to adjust the movement or flight path of the platform, ensuring precise approach and engagement with the target.
In the signal detection and processing stage, quadrant photodetectors offer higher detection efficiency, reliability, strong anti-interference ability, lower complexity and mass volume compared to multi-element detectors and infrared detectors, and is the main preferred solution for achieving optical tracking.
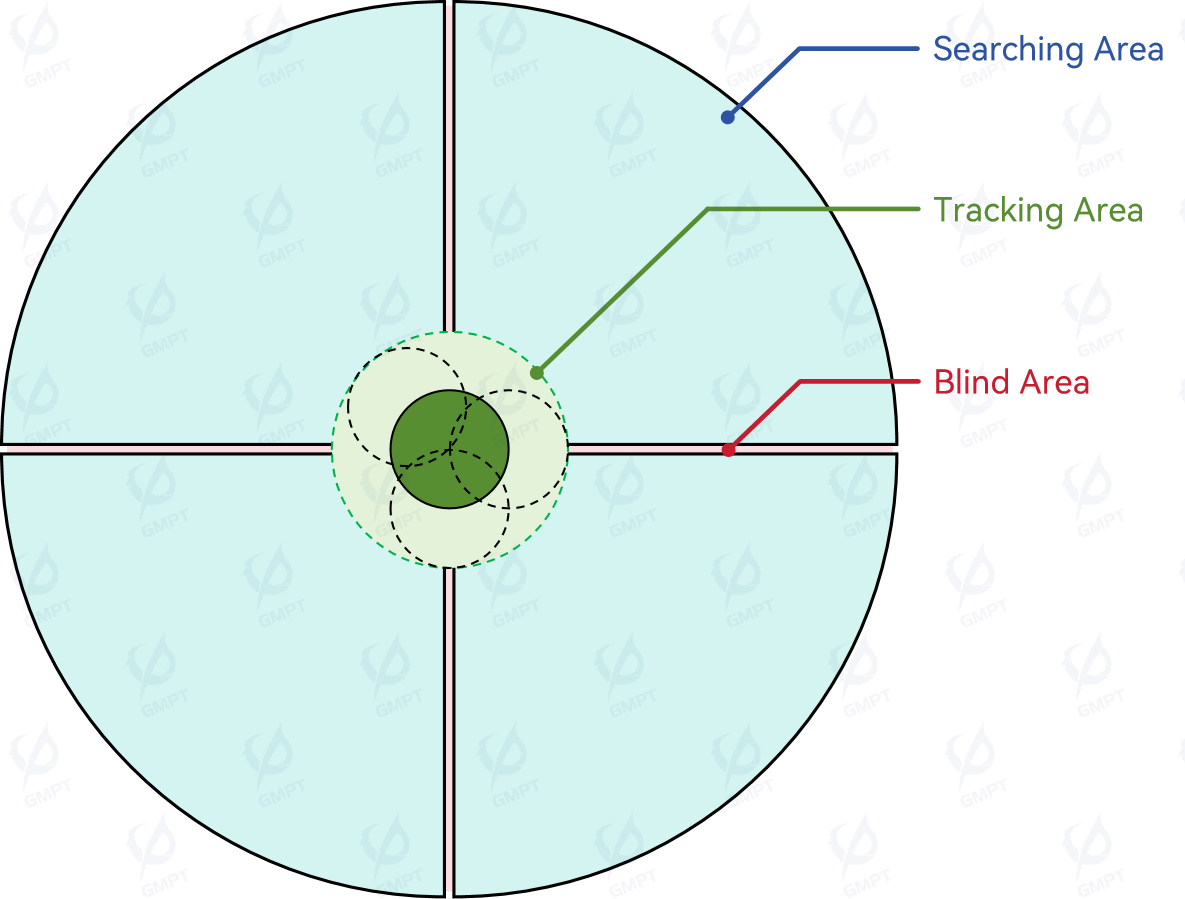
The detection principle of a four-quadrant photodetector involves dividing the photosensitive area into four quadrants, as illustrated in Figure [1]. The interstitial region between quadrants constitutes a "blind area", which should be minimized during design to enhance sensitivity. When the light spot falls within one or up to three quadrants, the detector can only ascertain the quadrant(s) occupied by the target but cannot precisely determine its coordinate position. This peripheral region is designated as the "search area". When the light spot simultaneously covers all four photosensitive areas, the centroid of the light spot can be calculated using theoretical formulas. This central region, where accurate tracking is possible, is referred to as the Tracking Area[1]。
.
2. Key Performance Indicators
The primary performance metrics for four-quadrant detectors encompass several critical aspects that ensure optimal functionality and accuracy in laser guidance systems:
Wide Field of View (FOV): A broad field of view is essential to accommodate a large search range, thereby enhancing the maneuverability of the guidance process. This characteristic is particularly important for maintaining target acquisition when the target is moving at high speeds or undergoing rapid directional changes, thus minimizing the risk of deviation from the intended trajectory.
Large Linear Response Region: An extensive linear response region facilitates more effective trajectory correction during the guidance process. This feature is crucial for mitigating errors induced by environmental factors such as airflow and mechanical vibrations, ensuring that the detector can accurately respond to deviations within its operational range.
Uniformity: Uniformity in photoelectric signal conversion is vital for achieving consistent and reliable performance. High uniformity across the detector’s surface ensures that the intensity of the received light is accurately translated into electrical signals, thereby improving overall measurement precision.
High-Precision Angular Measurement: Accurate angular measurements are fundamental for precise trajectory correction. Enhanced angular resolution reduces the circular error probable (CEP) associated with reaching the target, thereby increasing the likelihood of accurate engagement.
These performance indicators collectively contribute to the robustness and reliability of four-quadrant detectors in laser guidance applications. By optimizing these parameters, the detectors can provide superior tracking accuracy and reliability, even under challenging operational conditions.
Here we employs Rayzen software to replicate and simulate the optical characteristics of a quadrant detector based on the lens data provided in Reference [2]. The simulation aims to comprehensively analyze the performance indicators of the detector, ensuring an accurate assessment of its operational capabilities.
Through this approach, we evaluate key parameters such as the field of view, linear response region, uniformity, and angular measurement precision. The use of Rayzen software allows for detailed modeling and analysis, providing insights into the detector's behavior under various conditions. This simulation facilitates a thorough understanding of the detector’s performance, thereby supporting its optimization for high-precision guidance applications.
3.Analysis process
The design specifications for receiving optical lenses are as follows:
| Working Wavelength | 1064.1nm |
| Entrance Diameter | 30mm |
| Total Length of Lens System | <45mm |
| Sensitive Area Diameter | 10mm |
| Receiver Field of View | Full:±11°,Linear:±4° |
| Spot Diameter within Linear FOV | 1±0.05mm |
| Spot Uniformity within Linear FOV | >75% |
Based on the aforementioned design requirements, we will simulate the completed lens system and conduct a comprehensive analysis focused on the following aspects:
Light Spot Position at Various Field of View (FOV) Angles: We will examine the position of the light spot across different FOV angles to assess the extent to which linear field of view requirements are satisfied.
Uniformity of Illumination Distribution: The uniformity of illumination distribution will be evaluated under varying FOV angles to determine if it meets the specified criteria.
Spot Diameter Evaluation: We will assess whether the diameter of the light spot at different FOV angles complies with the design specifications.
Comparison of Coordinate Calculation Methods: Various coordinate calculation methods will be evaluated and compared to identify the most effective approach for determining the centroid of the light spot.
4.Structural Modeling and Parameter Configurations
4.1 Geometry Parameters
| Components | Position | Material | Center Thickness | Diameter | Surface Name | Radius |
| Lens_01 | 0.00 | H-K9L | 3.50 | 35.82 | FrontSurface | 48.0000 |
| RearSurface | 44.5000 | |||||
| Lens_02 | 5.50 | H-LAK7A | 7.4 | 30.000 | FrontSurface | 28.6000 |
| RearSurface | 500.000 | |||||
| Lens_03 | 13.40 | H-K9L | 1.5 | 30.000 | FrontSurface | 0 |
| RearSurface | 0 | |||||
| Lens_04 | 15.00 | H-ZF5 | 4.0 | 22.672 | FrontSurface | 17.3000 |
| RearSurface | 21.0160 | |||||
| Lens_05 | 16.23 | H-ZF5 | 2.0 | 22.672 | FrontSurface | -34.155 |
| RearSurface | -204.104 | |||||
| Lens_06 | 29.40 | H-ZF5 | 2.0 | 17.170 | FrontSurface | -15.071 |
| RearSurface | -17.351 | |||||
| Lens_07 | 31.50 | H-LAF10LA | 3.0 | 17.296 | FrontSurface | 0 |
| RearSurface | -28.157 | |||||
| Lens_08 | 34.60 | H-ZF5 | 3.5 | 14.832 | FrontSurface | 9.82 |
| RearSurface | 24.7 | |||||
| Lens_09 | 41.62 | H-K9L | 0.8 | 9.146 | FrontSurface | 0 |
| RearSurface | 0 | |||||
| Receiver | 43.02 | ------ | ------ | 10.000 | ------ | 0 |
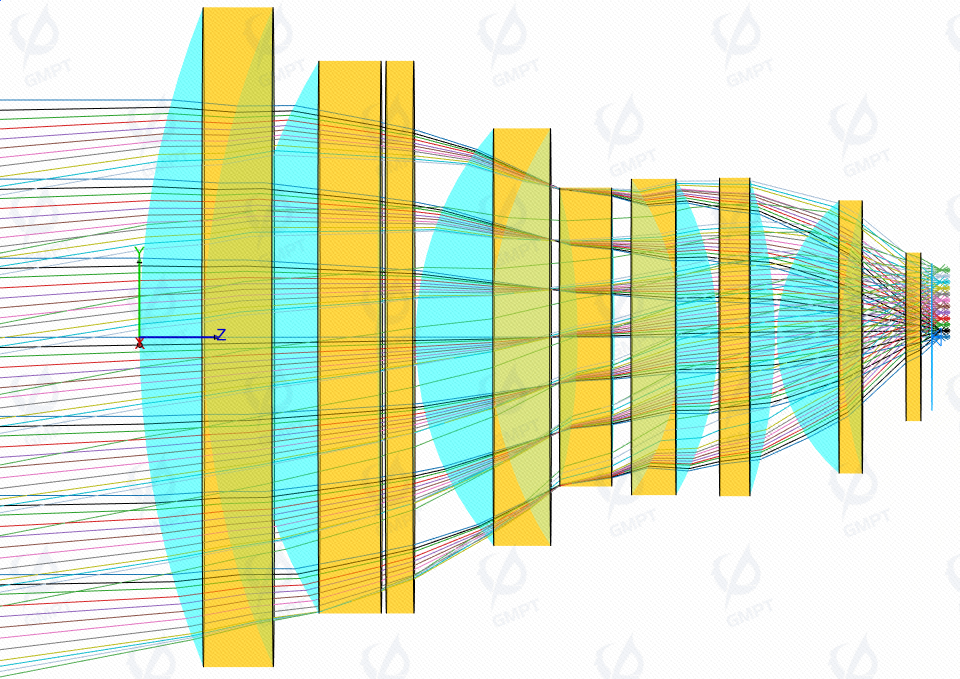
4.2 Modeling Scene Preview
5.Simulation Results
As Shown in Figure [3], the distribution of the light spot on the receiver and the central profile vary with the field of view angle from 0 ° to 11 °,The background colors in the line graph represent ratio of the peak illuminance values: below 75%, 75% ~ 80%, 80% ~ 85%, 85% ~ 90%, 90% ~ 95%, 95% ~ 100%. According to the design specifications, a min/max intensity ratio within the effective diameter of less than 75% is deemed unacceptable. The simulation results presented in Figure [3] are consistent with those reported in Figure [10] of the original article. The spot footprint maps from both sources exhibit substantial agreement, indicating that the modeling parameter settings and simulation outcomes are accurate and reliable.
5.1 Evaluation of Linear FOV
According to the definition provided in Reference [3]: the linear field of view (LFOV) is characterized by the condition where the light spot simultaneously covers all four photosensitive areas of the detector without overflow. Under these conditions, the centroid position of the light spot can be accurately calculated. The area within which this occurs is referred to as the "photosensitive surface linear zone," and the corresponding optical receiving field of view is termed the "linear field of view".
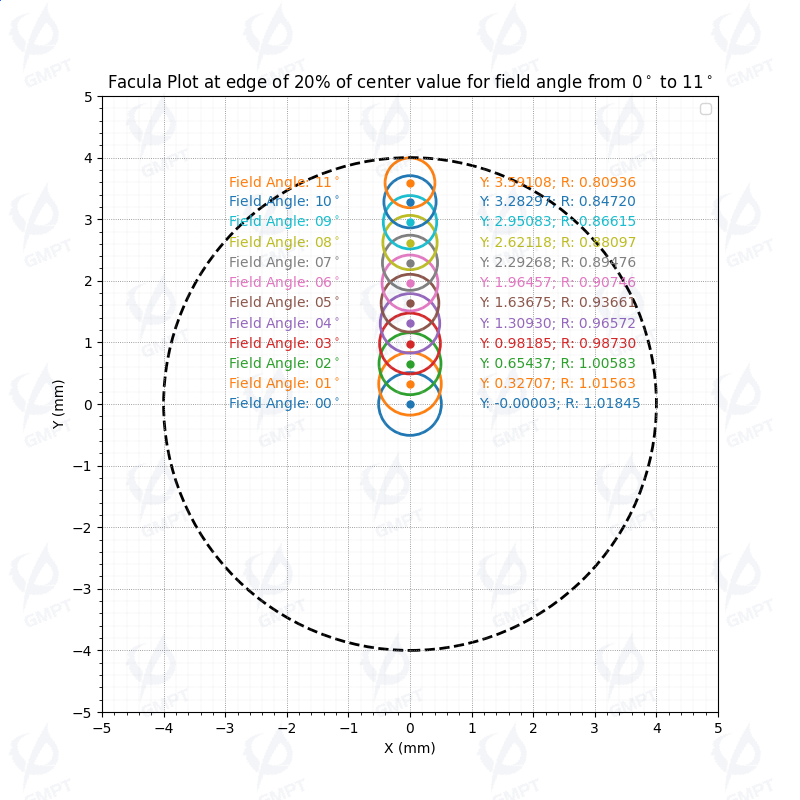
We have conducted a preliminary evaluation of the linear field of view range for the detector, as illustrated in Figure [4]. The diameter and center position of the light spot on the receiver vary with the field of view angle from 0° to 11°. Specifically, the diameter is defined as the average of the diameters measured at 0°, 45°, 90°, and 135° directions up to the 20% peak illuminance boundary. The center position of the light spot is determined by the centroid of the distribution integral. The detector is divided into four quadrants by x and y axis. According to design specifications, the required linear field of view is ±4°, where the light spot should fully cover all four quadrants. However, our analysis reveals that when the field of view angle reaches 2°, the light spot boundary has already moved away from the origin and no longer covers all four quadrants.
The diameter of the light spot on the photosensitive surface of the quadrant detector is generally specified to be half the diameter of the photosensitive surface. However, the performance index for the seeker requires a light spot diameter of 1 mm within the linear FOV, a criterion determined by specific application requirements-emphasize achieving high uniformity and maintaining a specified diameter size within the designated field of view range, as outlined in Reference [2].
To refine our understanding of the system's true linear range, we conducted an evaluation at intervals of 0.1°, as depicted in Figure [5]. Utilizing Rayzen software, we applied filters to the calculated data to separately analyze the statistical results for each of the four quadrants. Notably, all filters in Rayzen support post-processing without necessitating a re-run of the simulation. Given that the detection system only requires power values from the four quadrants, it can directly extract power data from these four grids.
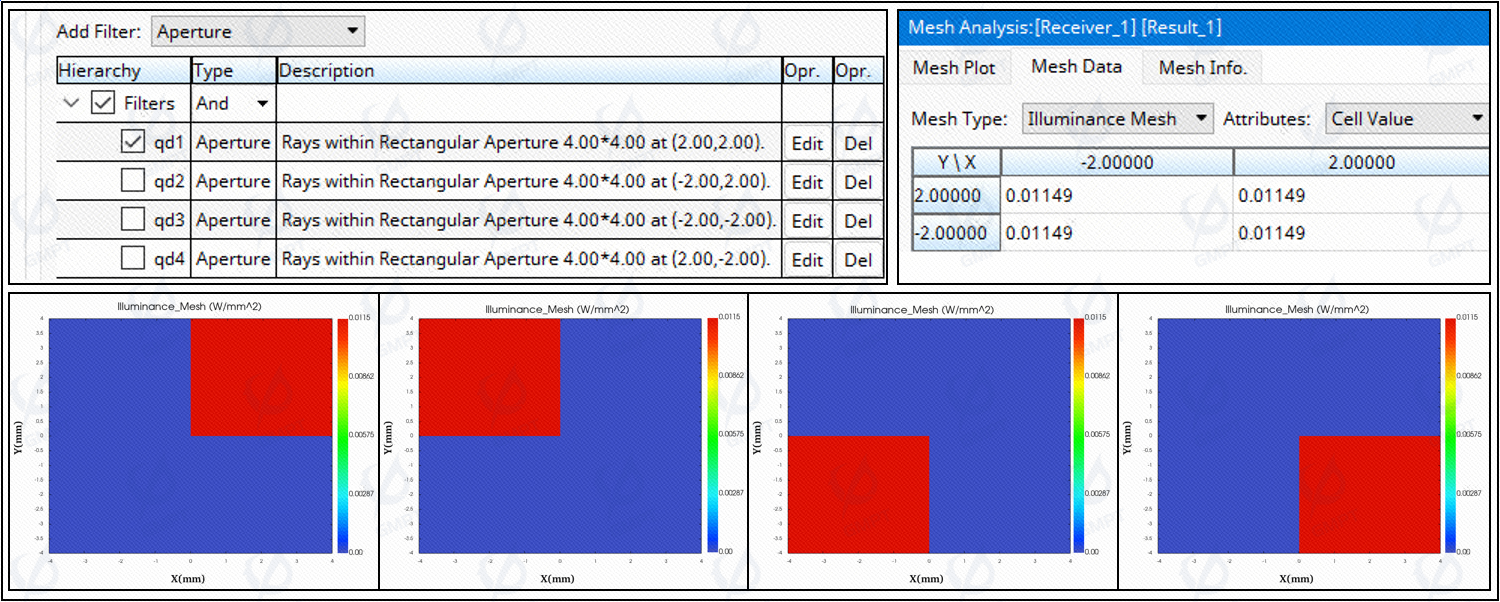
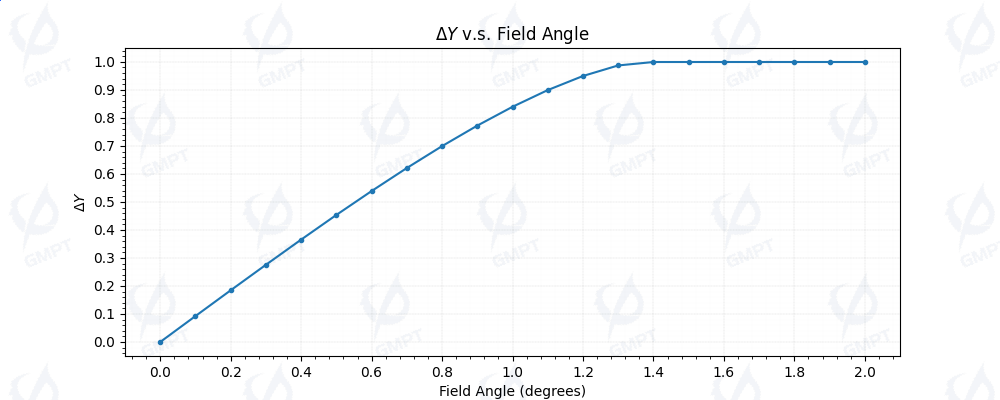
Considering the system's complete axisymmetry, evaluating one direction suffices, as illustrated in Figure [6]. Our analysis reveals that when the FOV angle reaches 1.2°, the relative change in ΔY with respect to the FOV angle begins to plateau. At this point, the light spot no longer covers all four quadrants simultaneously. Consequently, the linear field of view (LFOV) of the system is determined to be ±1.2°.
This result is reasonable and aligns with theoretical expectations. The ratio of the linear field of view range to the full field of view range should be approximately proportional to the ratio of the light spot diameter to the photosensitive surface diameter. Therefore, the identified LFOV of ±1.2° is consistent with the design parameters and performance characteristics of the detector.
5.2 Evaluation of Uniformity
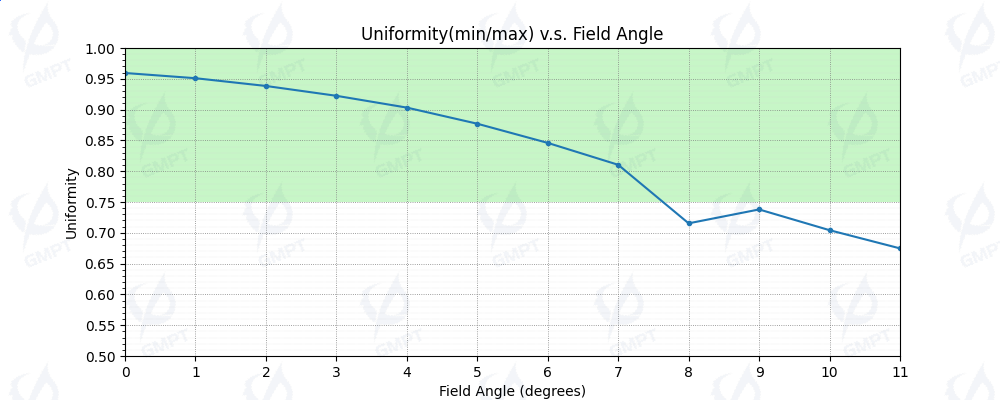
As shown in Figure [7], the uniformity of the light spot on the receiver varies with the field of view (FOV) angle from 0° to 11°. Uniformity is calculated using the formula (\text{min/max}), where the green area represents the uniformity range specified by the design requirements.
The analysis reveals that:
- Within a FOV angle of ±7°, the spot uniformity remains above 80%.
- Within a FOV angle of ±6°, the spot uniformity reaches 85%.
- Within a FOV angle of ±4°, the spot uniformity achieves 90%.
These evaluation results are superior to those reported in the original article. This improvement can be attributed to the data processing methodology employed in Rayzen software. Specifically, when analyzing the simulation results, the minimum power density is selected from within the effective light spot range, thereby avoiding outliers introduced by boundary truncation effects.
5.3 Evaluation of Spot Diameter
Analysis of Light Spot Diameter Variation with Field of View
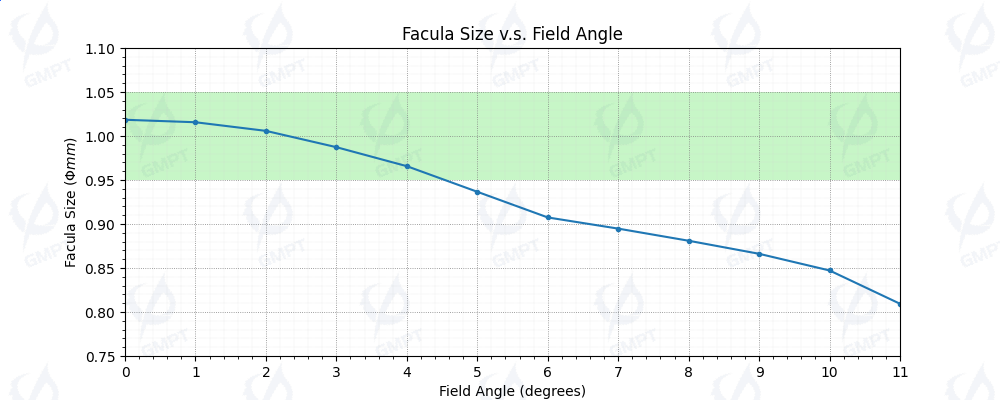
As illustrated in Figure [8], the diameter of the light spot on the receiver varies with the FOV angle from 0° to 11°. The diameter is defined as the average of the diameters measured at 0°, 45°, 90°, and 135° directions up to the 20% peak illuminance boundary. The green area represents the range of light spot diameters specified by the design requirements.The analysis reveals that: Within a FOV angle range of ±4°, the spot diameter remains within 1 ± 0.05 mm, which is fully consistent with the design pecifications.
5.4 Calculation of spot Centroid
Assuming light intensity distributes sufficiently uniformly, the relative position coordinates of the light spot can be calculated according to the sum difference method using the following formula:
The formula for calculating the centroid of the light spot built-in Rayzen software is
where is illumination distribution。
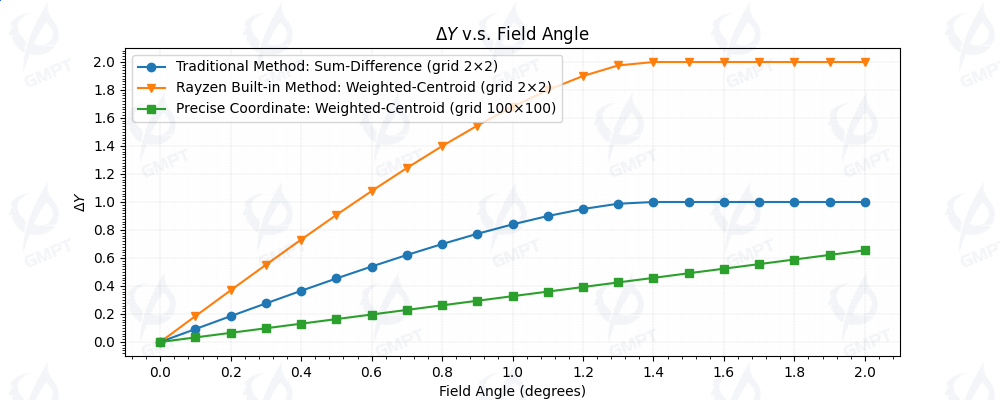
We have conducted a comparative analysis of the relative position coordinates of the light spot calculated using various methods, as illustrated in Figure [9]. The symbols used in the figure represent different calculation approaches:
●denotes the calculation data obtained using the classic sum-difference ratio method.▼represents the calculation data from the built-in centroid algorithm in Rayzen software.■indicates the actual centroid position data derived from grid encryption using the centroid algorithm.
The analysis reveals that the actual centroid position exhibits a linear relationship with the field of view (FOV) angle. Both the difference ratio method and the centroid method yield identical linear fields of view; however, the centroid method demonstrates greater sensitivity to the boundaries of the linear field of view.
In the sum-difference ratio method for calculating spot coordinates in a four-quadrant sensor, the physical quantities used can be either the spot area within each quadrant or the received light intensity within each quadrant, which is subsequently converted into an electrical signal through photoelectric conversion. This method demands high uniformity of the light spot but offers the advantage of requiring only one division calculation, making it highly efficient.
The built-in centroid algorithm in Rayzen software involves additional calculations, including four multiplications, but accounts for weighting the illumination intensity and relative position within each quadrant. This approach reduces the stringent requirement for spot uniformity, making it more robust against design requirements and manufacturing errors.
6. Summary
Summary and Conclusions
This study conducted a comprehensive simulation of a four-quadrant detector using Rayzen software, successfully replicating the phenomena described in existing literature and delving into the performance characteristics of the detector under specific design requirements. Although the achieved linear field of view (LFOV) was limited to ±1.2°, which did not fully meet initial design expectations, this result remains within a reasonable range. This conclusion is supported by the approximate linear relationship between the ratio of the LFOV range to the full field of view (FFOV) range and the ratio of the light spot diameter to the photosensitive surface diameter. Therefore, for certain specialized application scenarios, it may be necessary to adjust design parameters based on actual needs to ensure optimal performance.
The simulation results also confirm that both the uniformity and the spot diameter of the detector meet the design specifications, validating the effectiveness of the structural design. Additionally, we compared and analyzed the performance of traditional sum-difference ratio methods with Rayzen software's built-in centroid algorithm for calculating spot coordinates. Both methods exhibit distinct advantages: the sum-difference ratio method offers faster response times in certain situations, while the centroid algorithm demonstrates higher accuracy and stability. The selection between these methods should be guided by specific application scenarios and user requirements.
By leveraging advanced simulation tools and technologies, this study enhances our understanding of photodetector performance and identifies areas for improvement. Such insights are crucial for meeting the growing demand for precision measurement applications. Future research could explore further refinements in detector design and optimization techniques to achieve broader LFOV ranges and improved performance metrics, thereby advancing the capabilities of photodetectors in high-precision guidance and tracking systems.