Stray Light Analysis of the Cooke Triplet Lens Using Rayzen Software
Taking the classic Cooke Triplet lens as an example, we explore the analysis methodology and operational steps for conducting stray light analysis using Rayzen software.
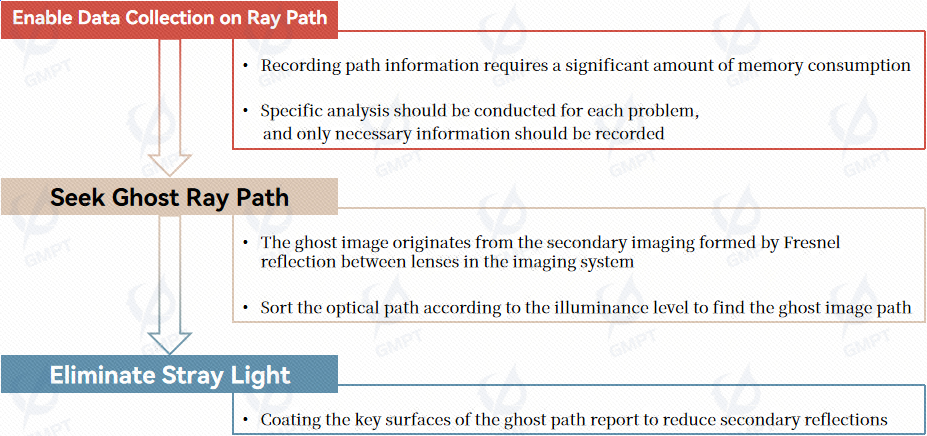
I. Analysis Workflow
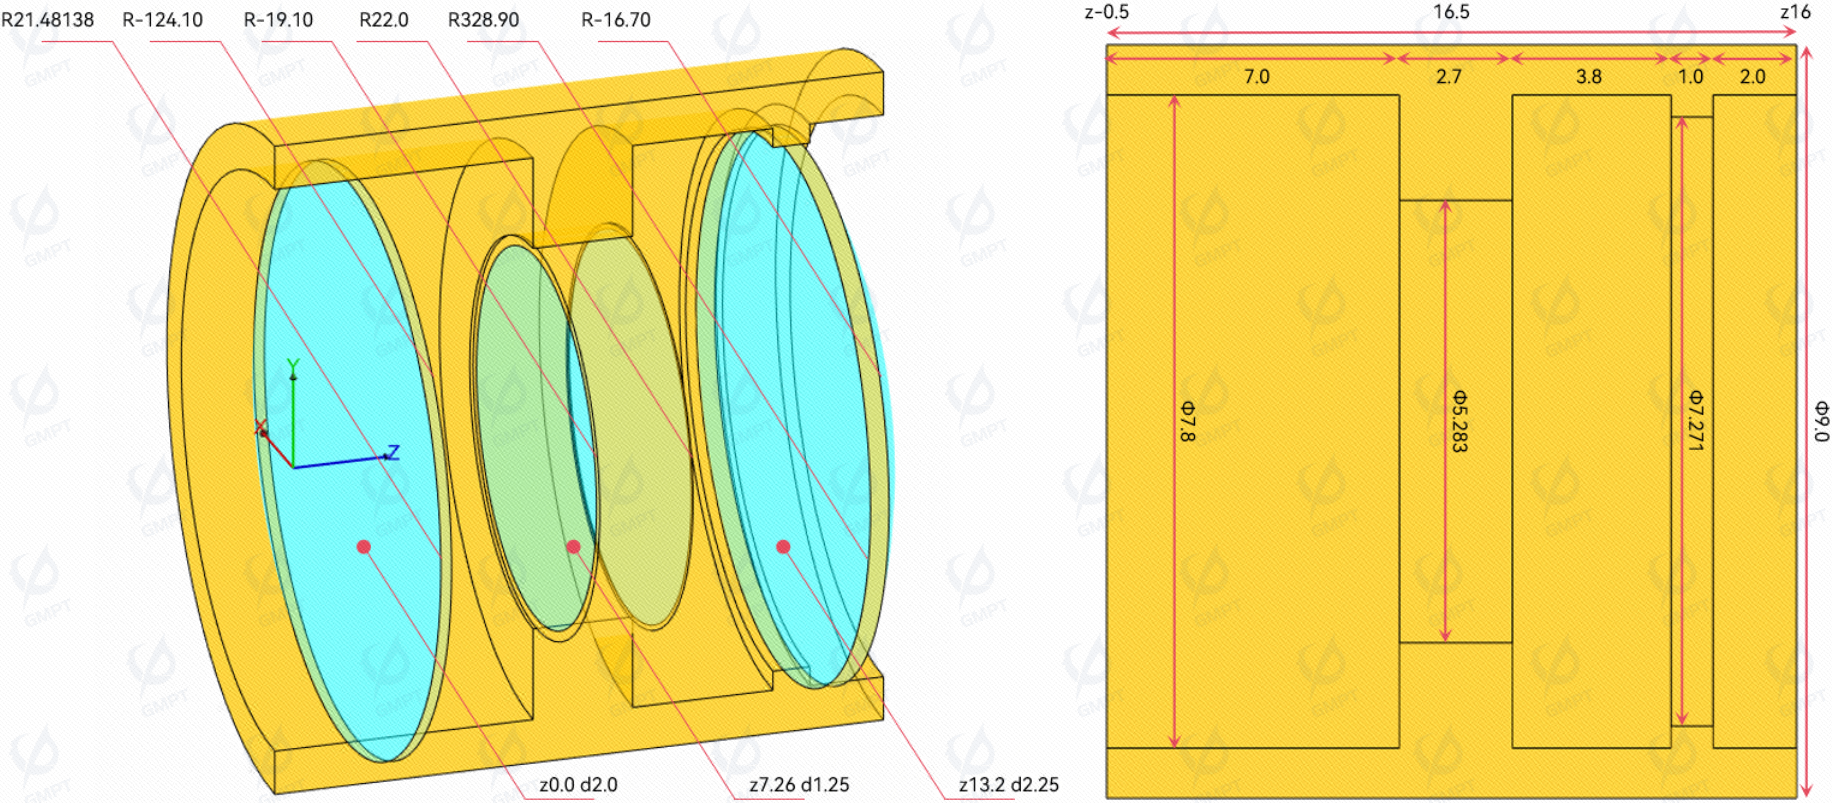
II. Model Construction
| Components | Location | Material | Center Thickness | Diameter | Surface Name | Optical Property | Radius | Clear Diameter | Mechanic Diameter |
| Lens_01 | 0.00 | SK16 | 2.00 | 15.600 | FrontSurface | fresnel | 21.48138 | 15.600 | 15.600 |
| RearSurface | fresnel | -124.100 | 15.600 | 15.600 | |||||
| Lens_02 | 7.26 | F4 | 1.25 | 10.566 | FrontSurface | fresnel | -19.1000 | 10.000 | 10.566 |
| RearSurface | fresnel | 22.00000 | 10.280 | 10.566 | |||||
| Lens_03 | 13.2 | SK16 | 2.25 | 14.542 | FrontSurface | fresnel | 328.9000 | 14.542 | 14.542 |
| RearSurface | fresnel | -16.7000 | 14.542 | 14.542 |
Geometric parameters of the model.
III. Control Conditions
| Ray Number | Preview Ray Number | Max Intersections per Ray | Max Segments per Ray | Relative Ray Power Threshold |
| 10,000 | 100 | 10,000 | 100,000 | 1e-7 |
Simulation control conditions.
IV. Excitation Conditions
| Source Type | Surface Source |
| Power | 1.0W |
| Energy Distribution | Aim Region |
| Shape | Circular, Radius=8.3mm |
| Location | -22.00 |
| Spatial Distribution | Uniform |
| Angular Distribution | Uniform |
| Angle Boundaries | Collimated along +z axis |
| Spectrum | Blackbody Temperature 6500K,Discrete,Spectrum Range 360nm ~ 830nm |
| Receiver | Surface Receiver,Circular,Radius=20.0mm |
Light source and receiver parameter settings.
V. Processing and Analysis of Simulation Results
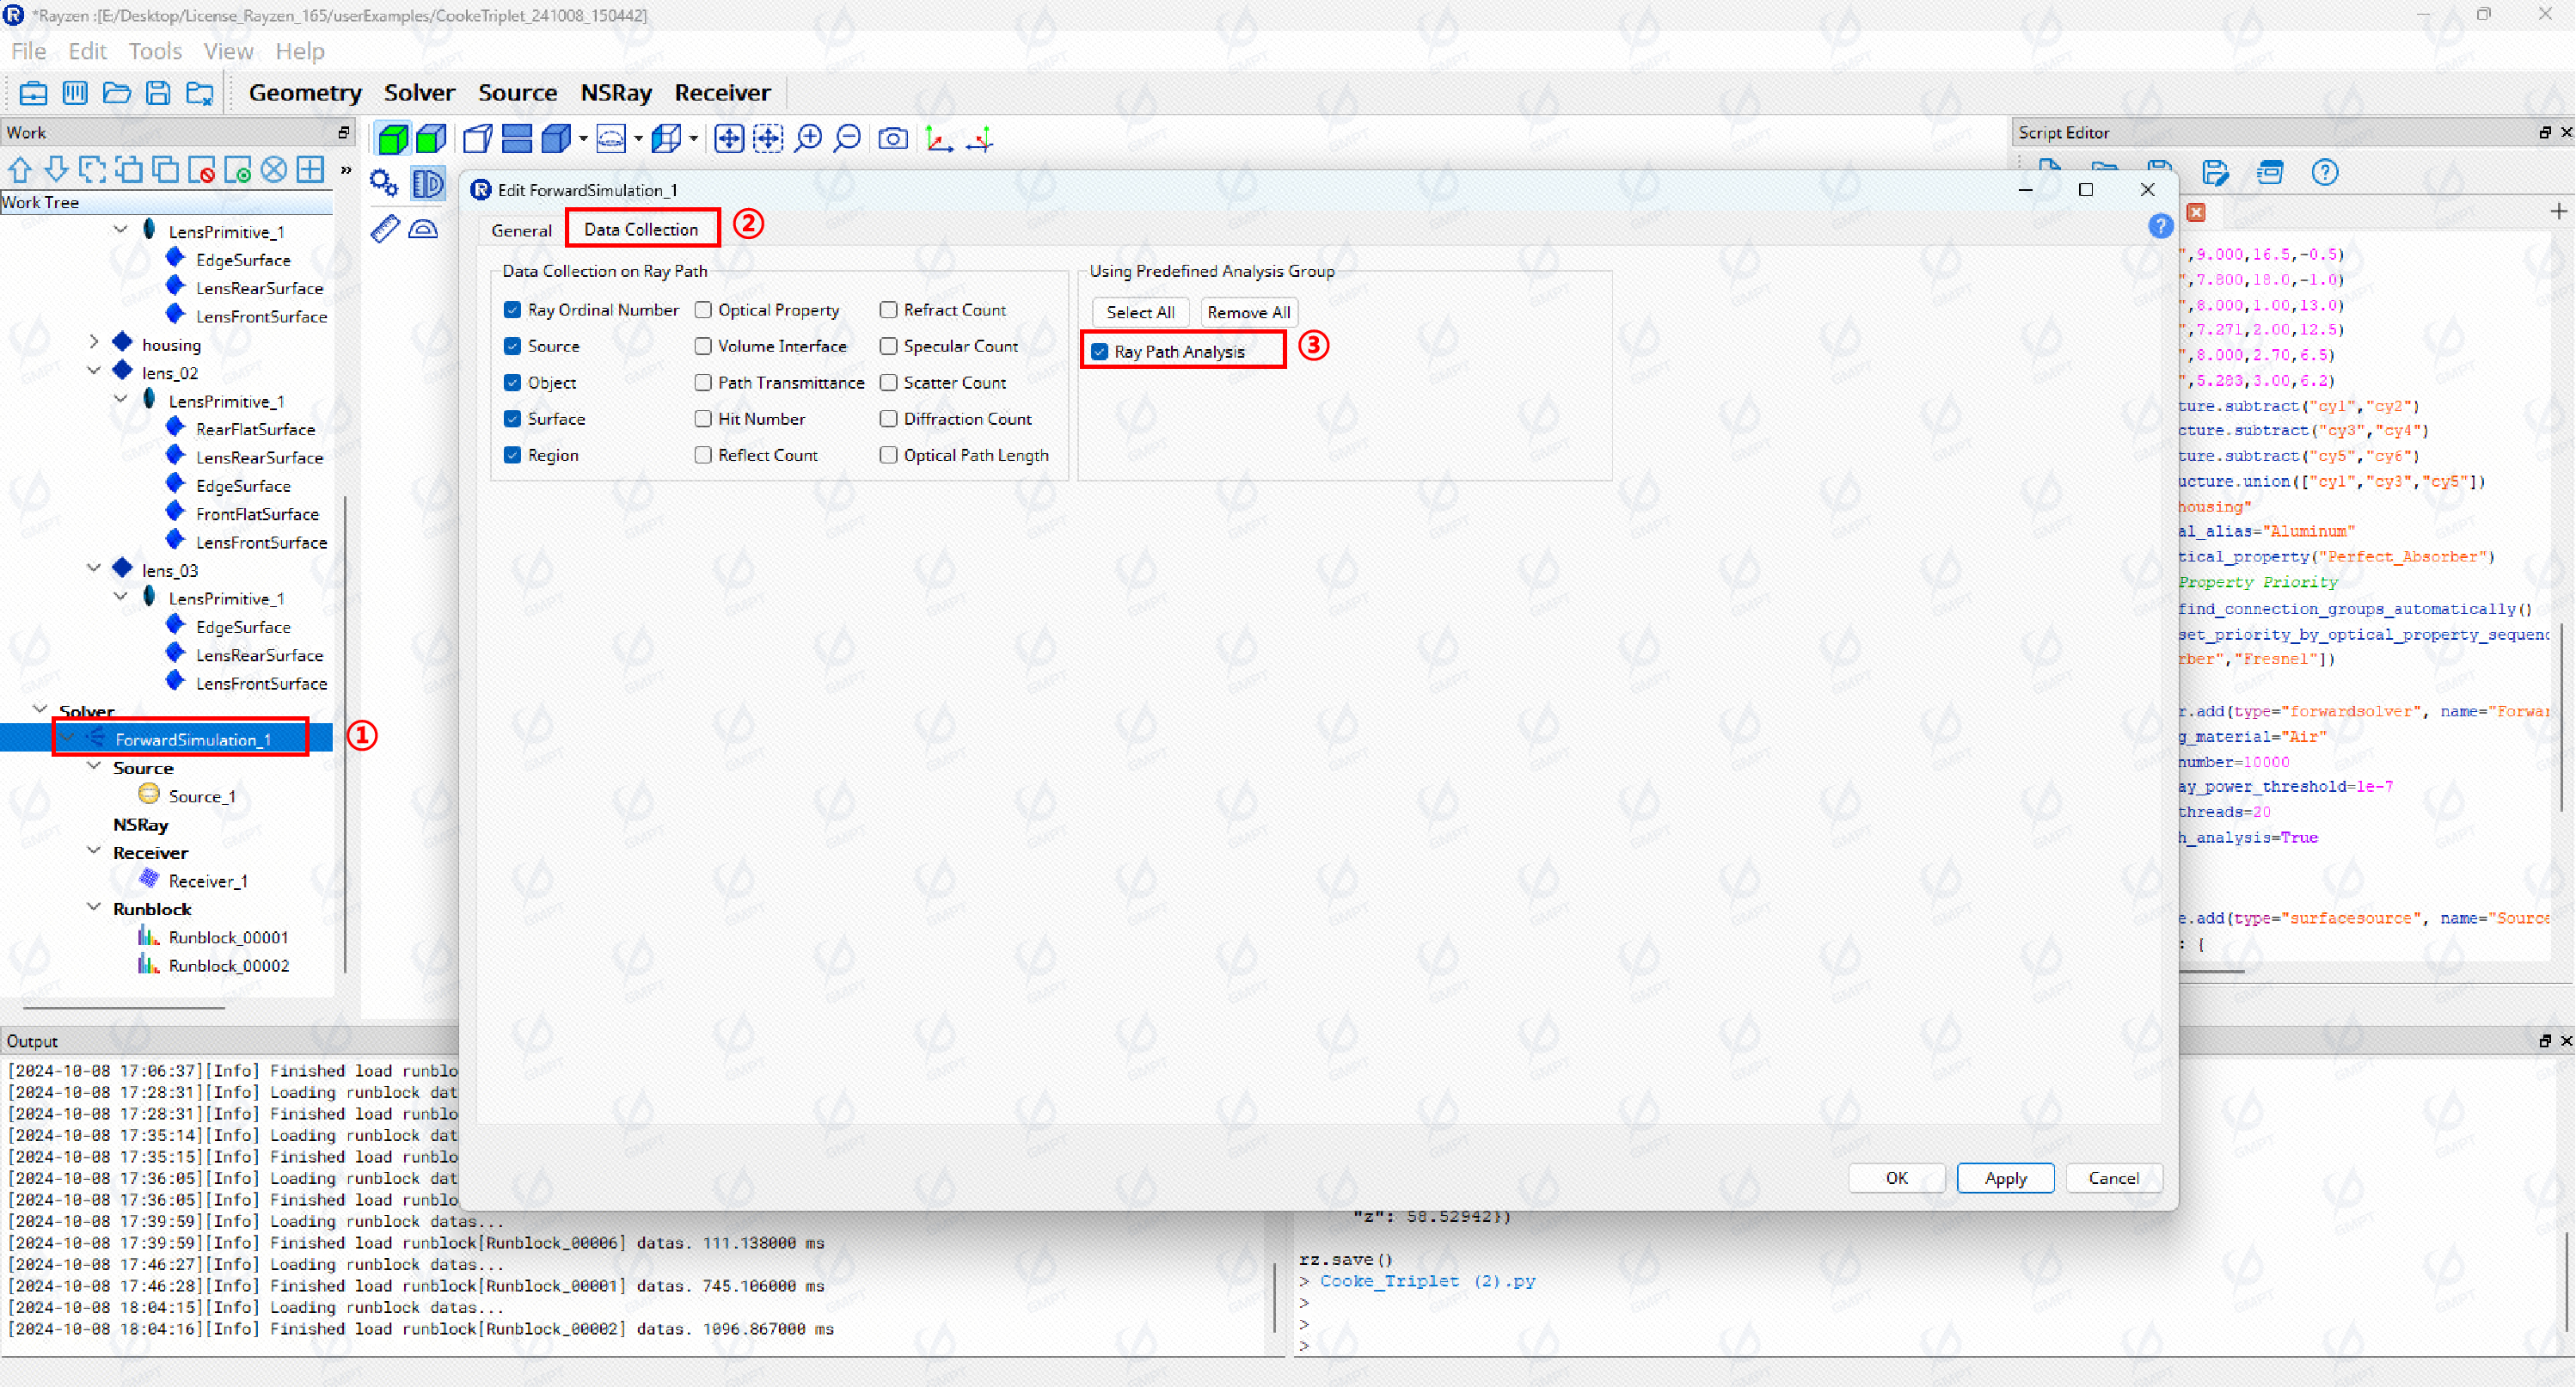
Enabling Path Information
Before running the simulation, in ForwardSimulation ![]() Data Collection
Data Collection ![]() Using Predefined Analysis Group , check Ray Path Analysis. Rayzen will collect and record relevant information during tracing to support path analysis.
Using Predefined Analysis Group , check Ray Path Analysis. Rayzen will collect and record relevant information during tracing to support path analysis.
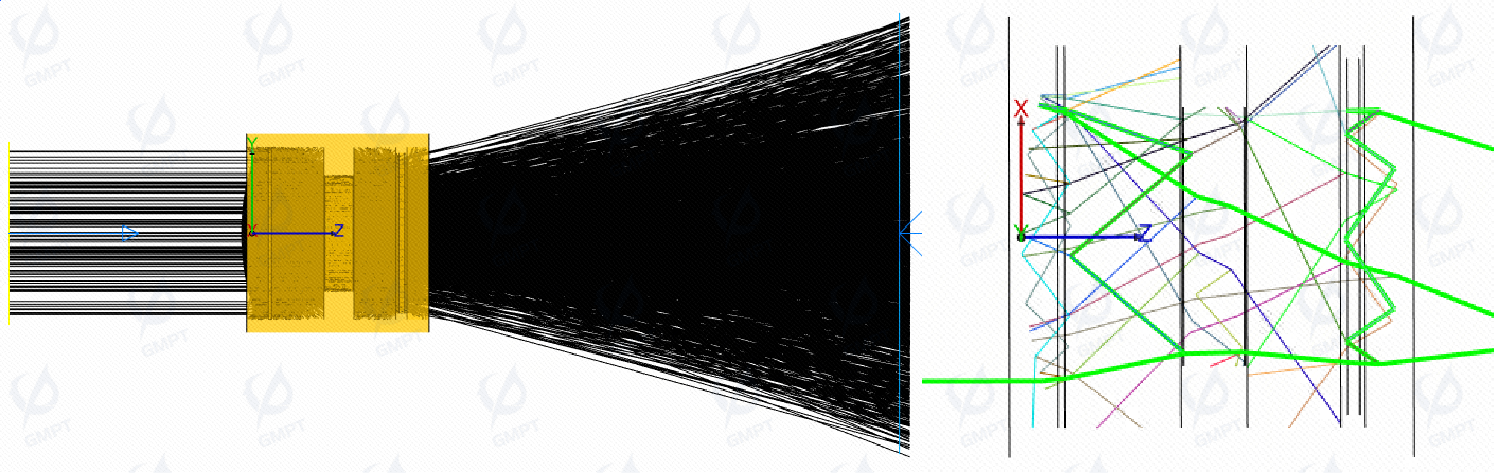
Using power splitting with a low threshold of 1e-7, 100 preview rays split into 200,626 rays hitting the receiver. As shown, one randomly selected ray forms 62 optical paths in split mode, with three paths reaching the receiver.
Finding Ghost Image Paths
This example does not consider the effects of aperture and surface cleanliness and only analyzes ghost images caused by Fresnel reflections on uncoated smooth surfaces. As shown, after running the simulation, add the settings for receiver mesh size and resolution, and click Run Mesh Analysis to view the total illuminance of all optical paths.
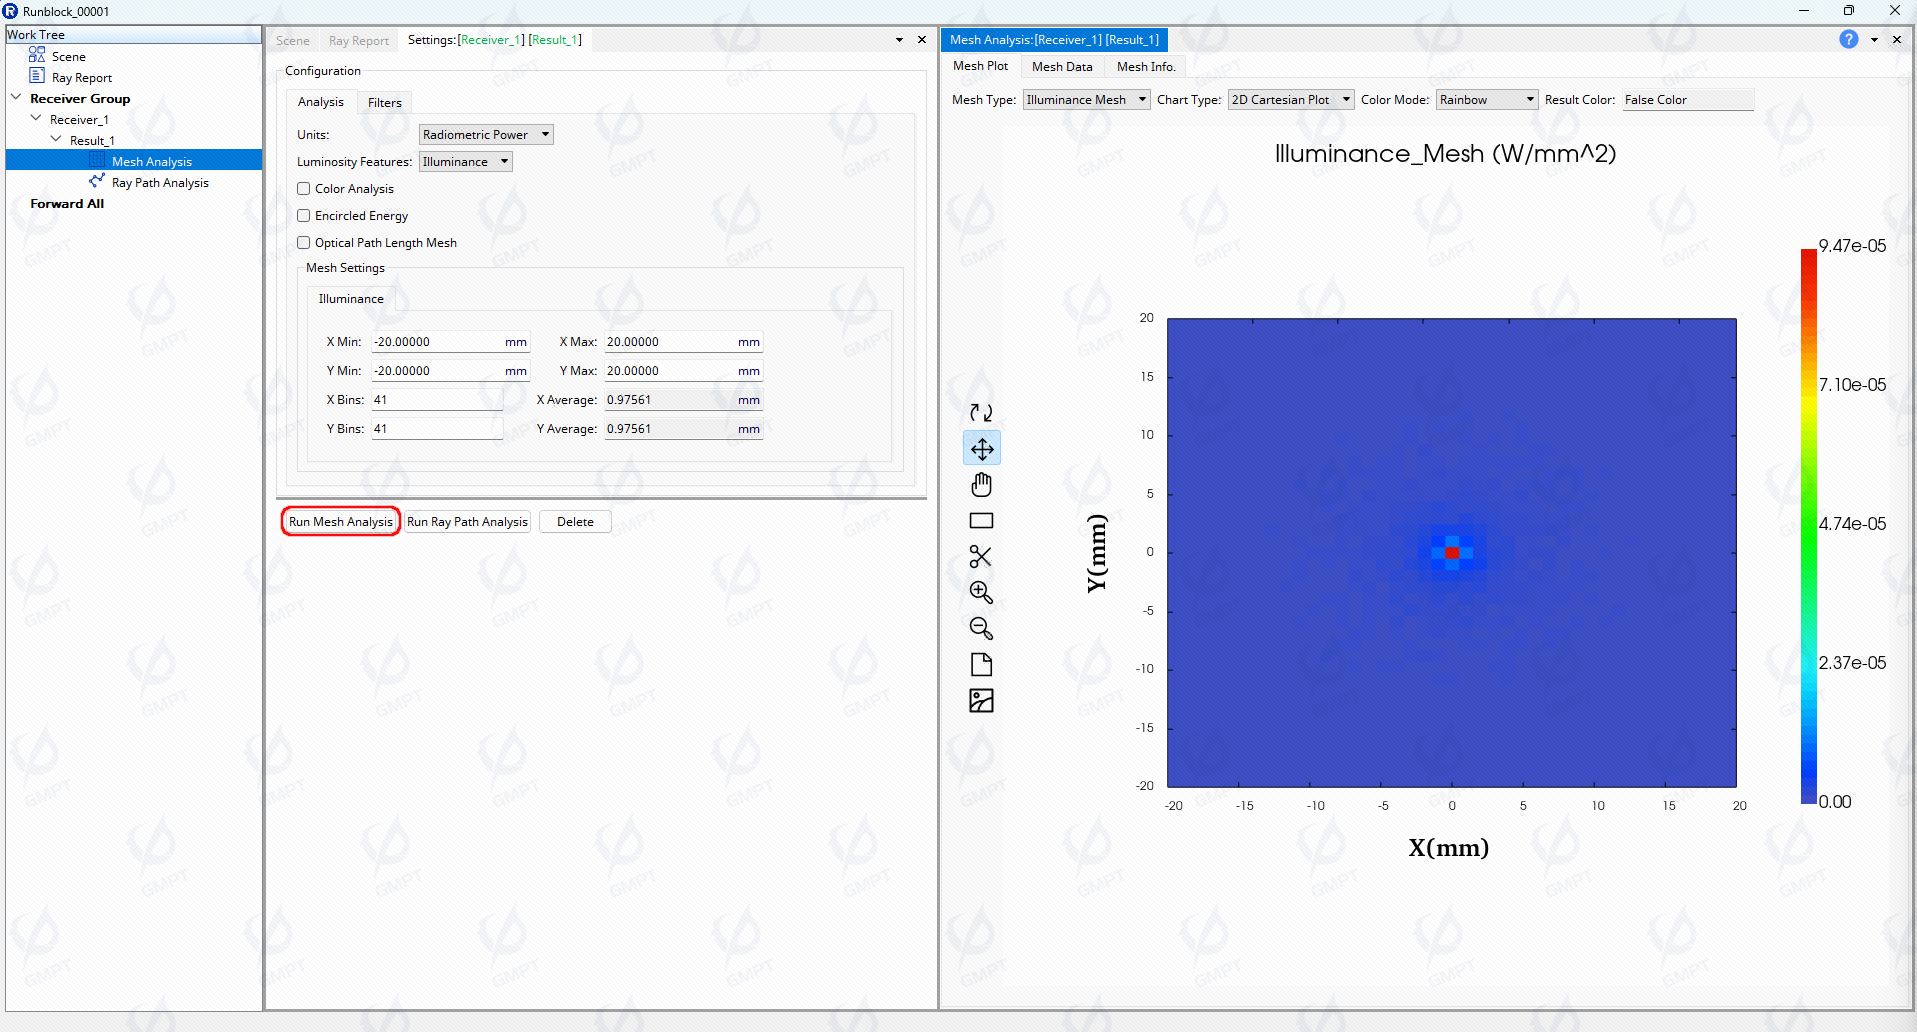
Click Run Ray Path Analysis to view the list of optical paths and detailed information for each path. In the scene, under the  Show Rays button, select
  Show Filtered Rays and select the corresponding analysis results. Now, by freely selecting or deselecting paths in the path list, you can dynamically view the light path trajectory for each path in the scene.
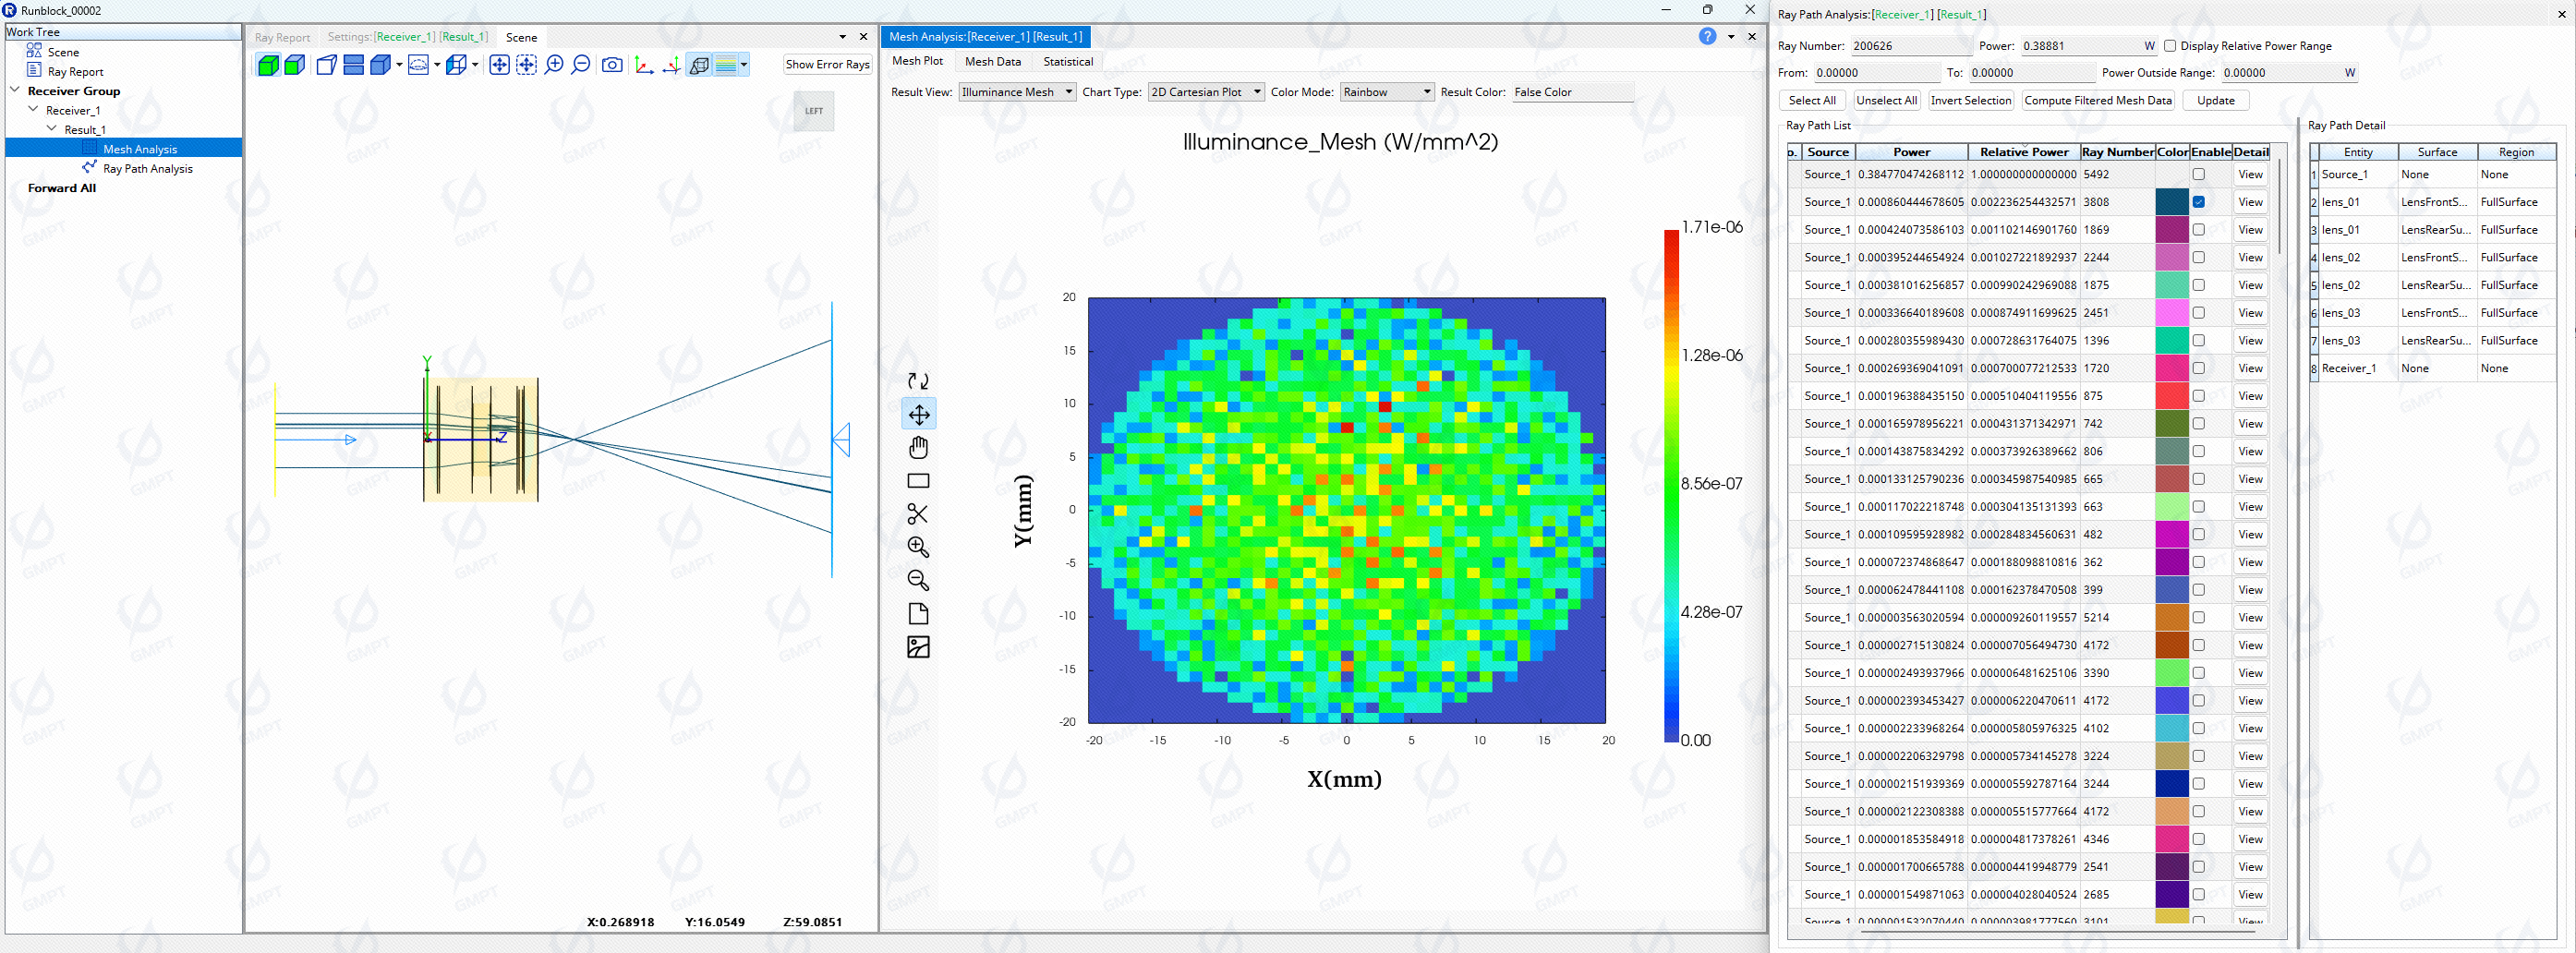
As shown, 10,000 rays form a total of 212 optical paths. Clicking the Relative Power header sorts the paths by relative power, revealing the path with the highest relative power as the main path of interest.
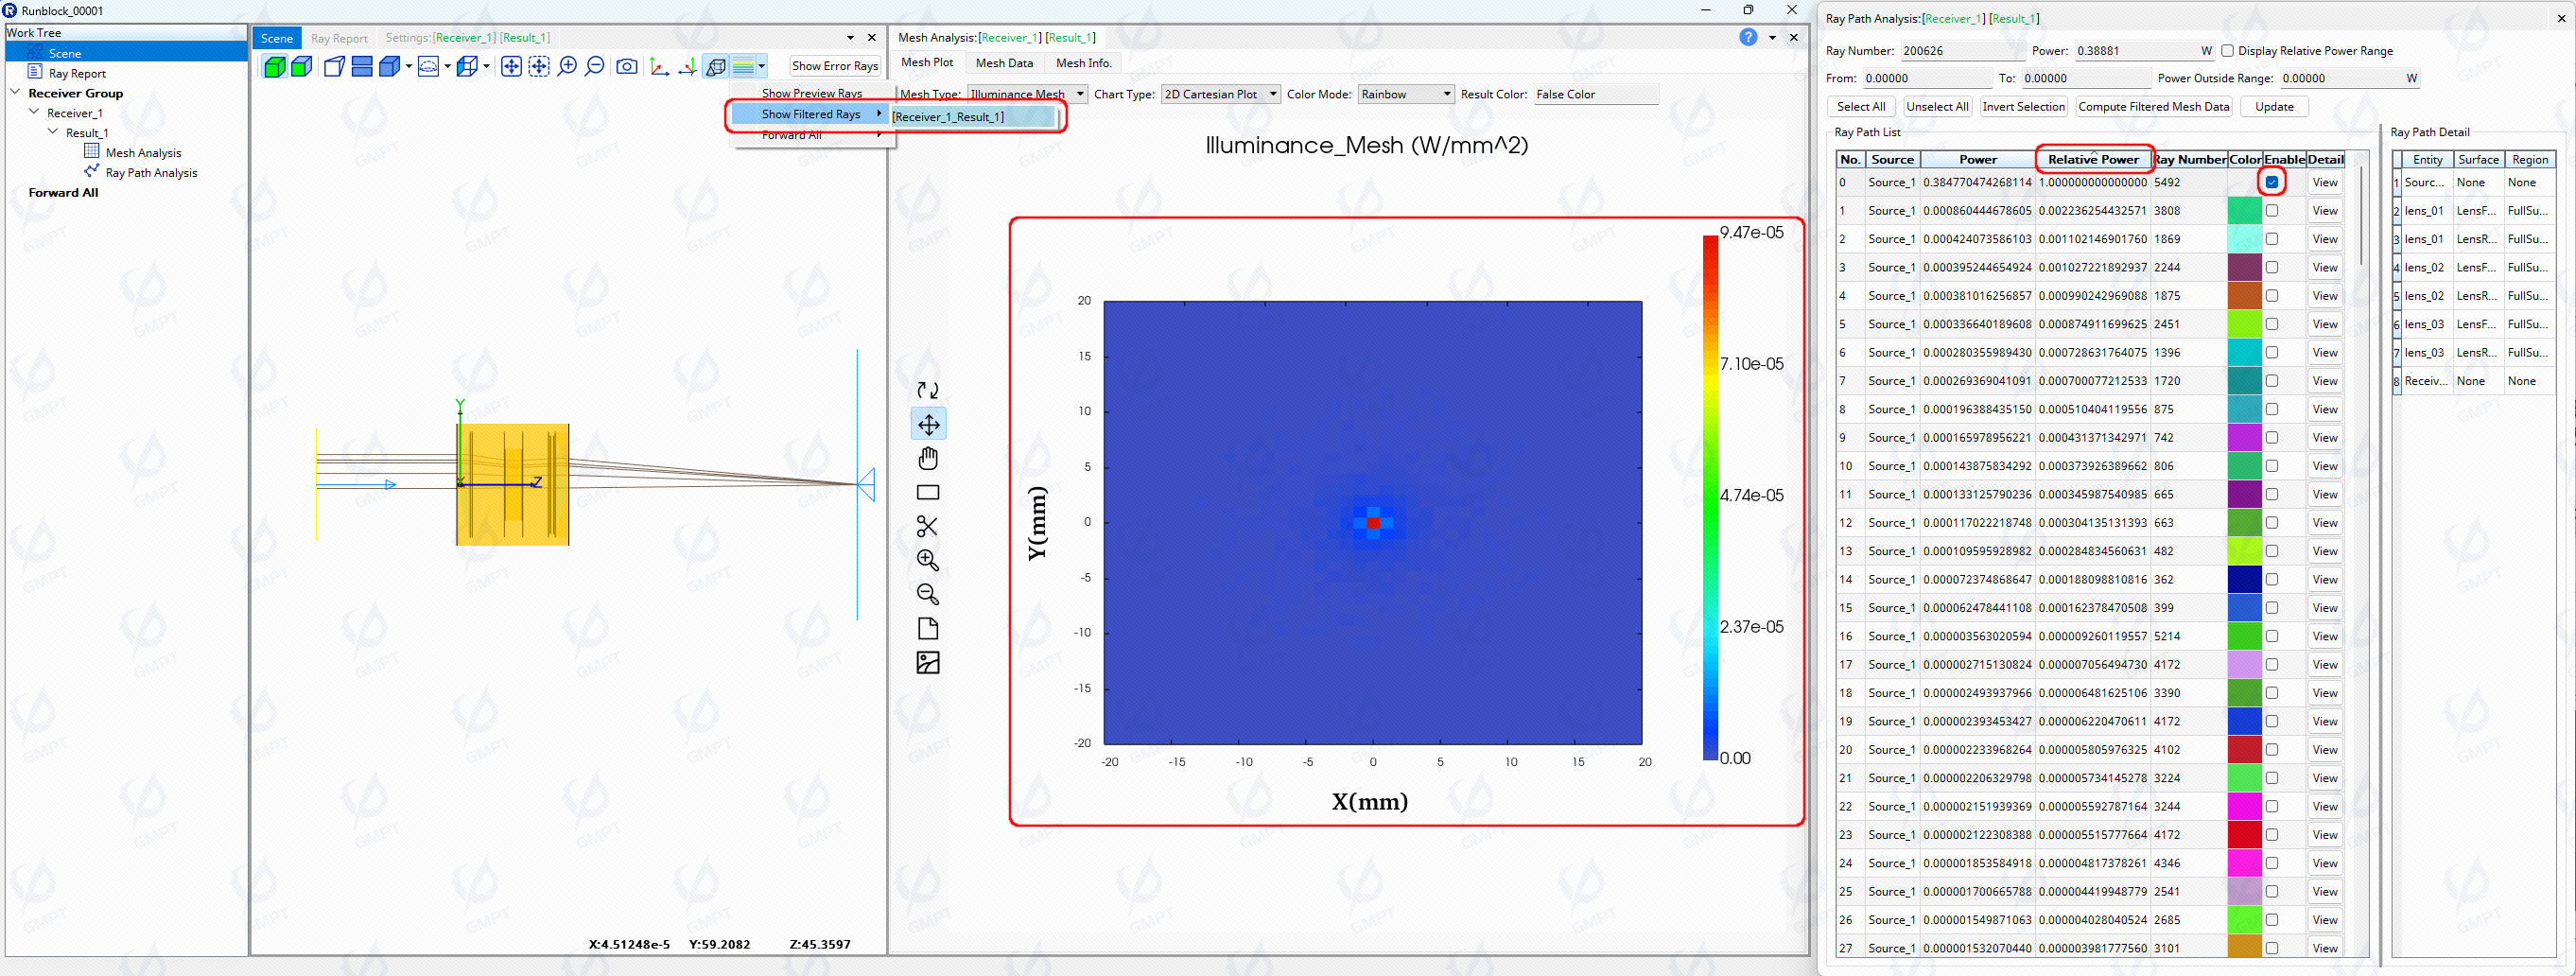
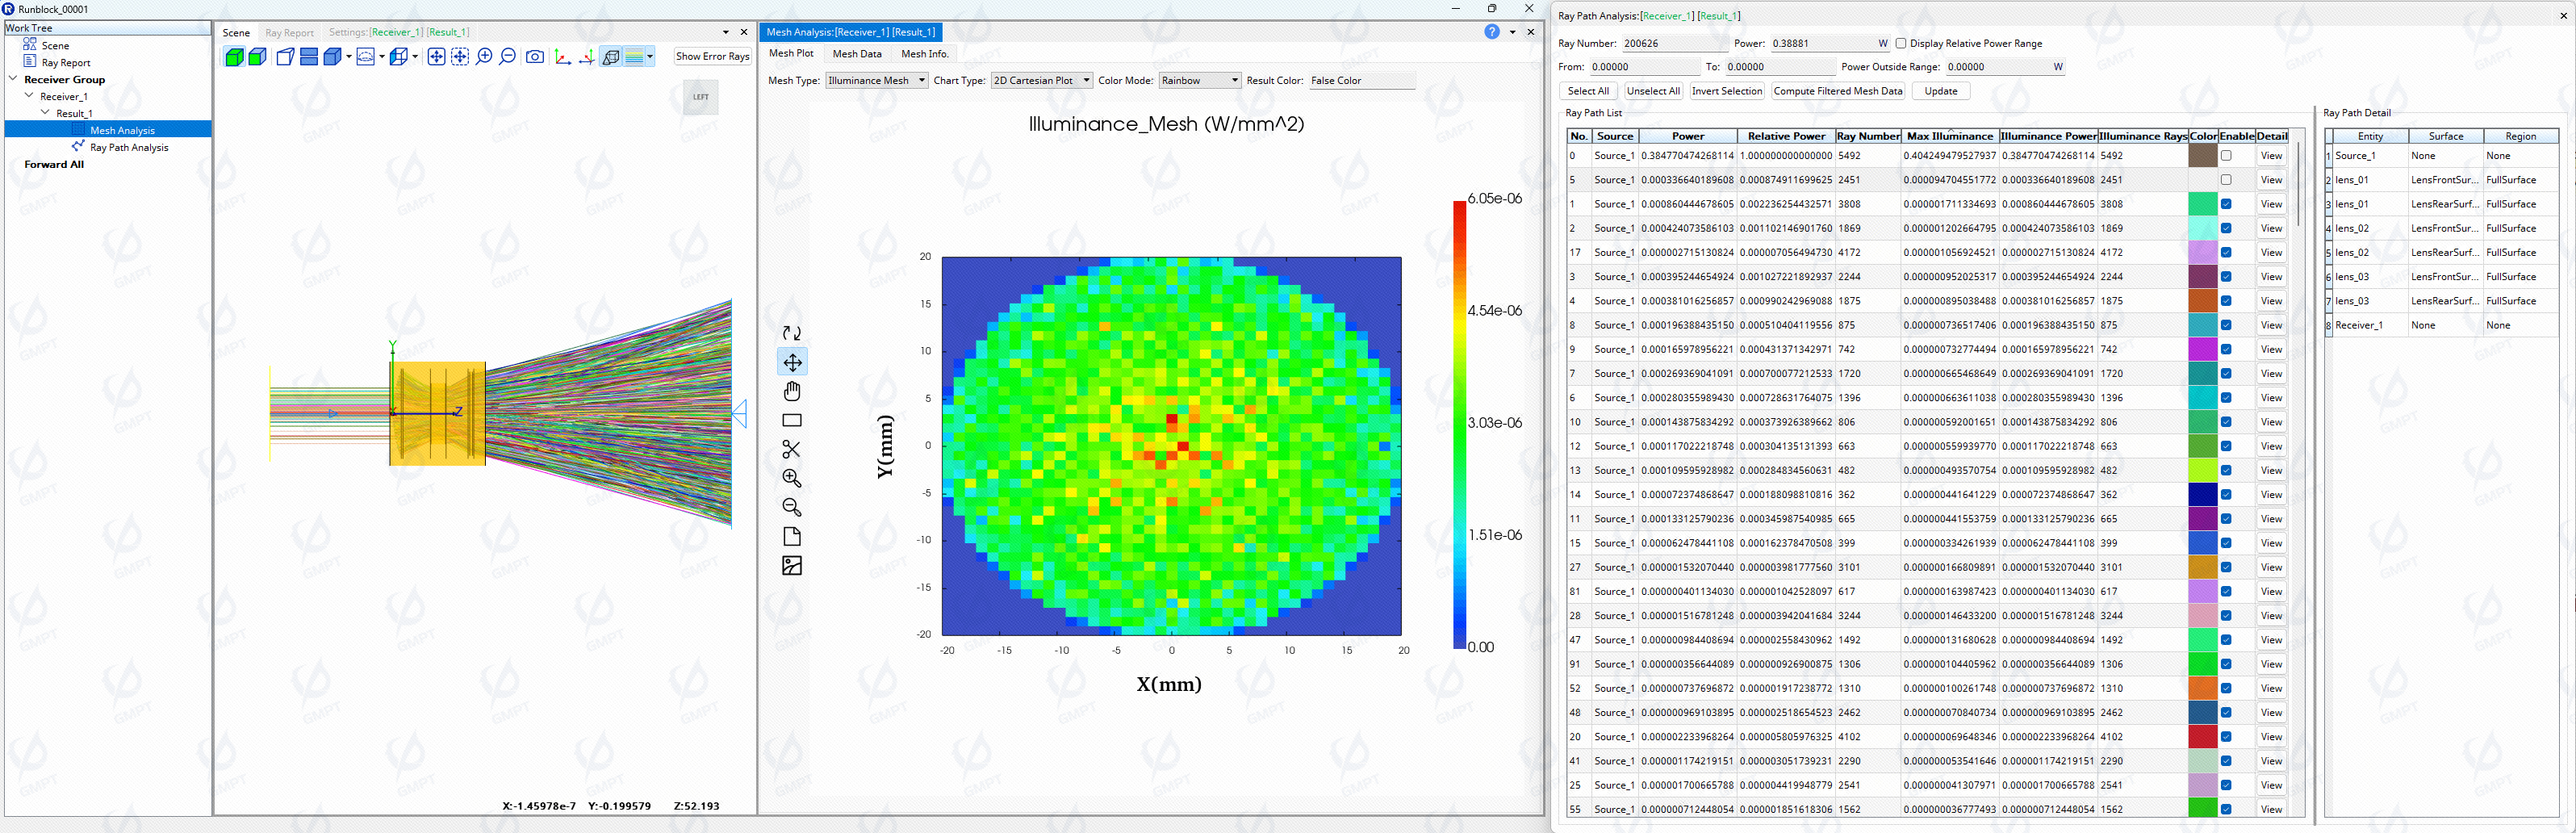
With the selected path checked, click Update to view the illuminance image formed by rays in this path on the receiver. As shown below, 5,492 rays in the main path contribute 0.38477 W of power, while all 200,626 rays across all paths contribute 0.38881 W.

By sorting by relative power, examine the illuminance of the second highest path. As shown, the rays on the receiver in this path are evenly distributed without forming an image, indicating this is not the ghost image path we are looking for.
Ghost images form from secondary reflections between mirror surfaces. Therefore, the maximum illuminance of each path can be calculated and sorted to locate ghost paths. As shown, click Compute Filtered Mesh Data to calculate the illuminance for each ray path, then sort by maximum illuminance and check the second path.
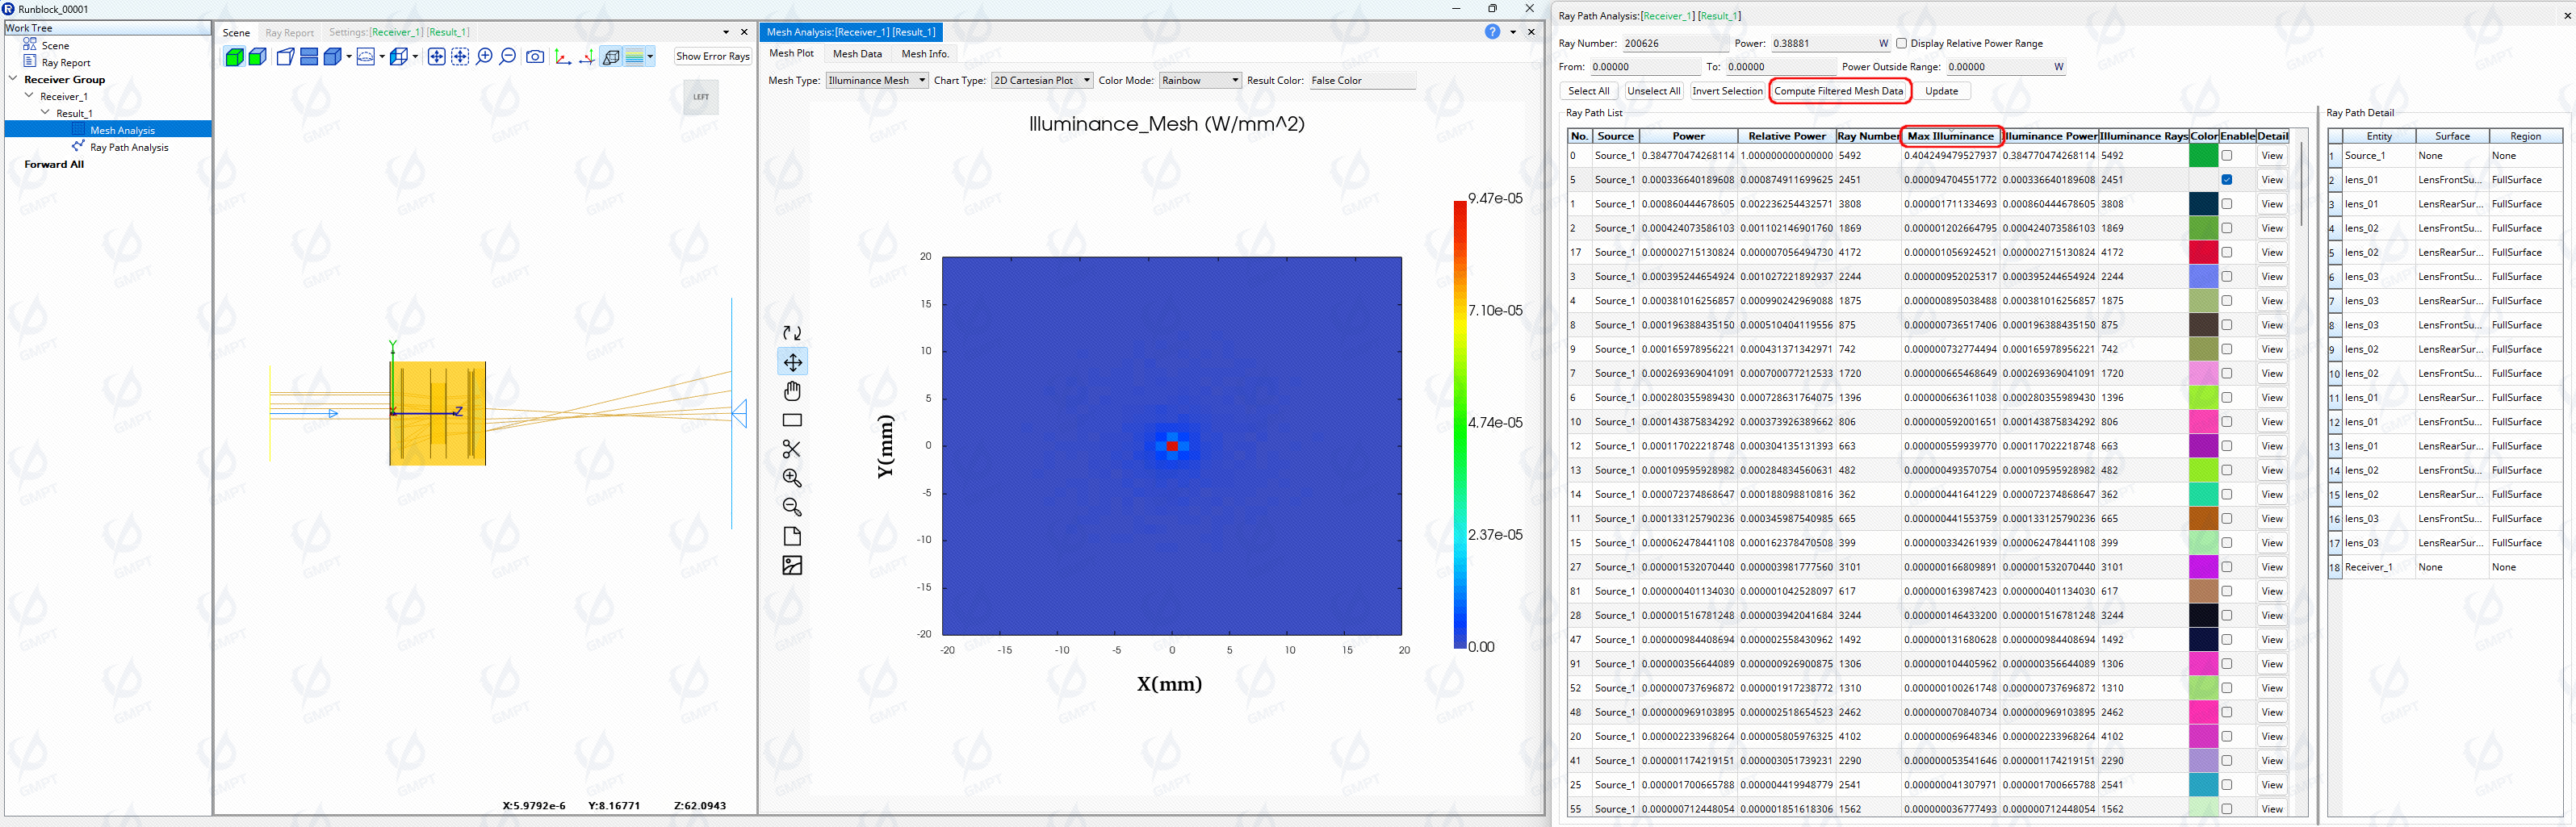
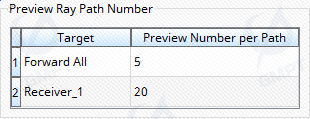
The rays are focused on the receiver, though fewer preview rays are available. Increase the number of preview rays in ForwardSimulation ![]() Preview Ray Path Number to 20, rerun the simulation, and examine the optical paths.
Preview Ray Path Number to 20, rerun the simulation, and examine the optical paths.
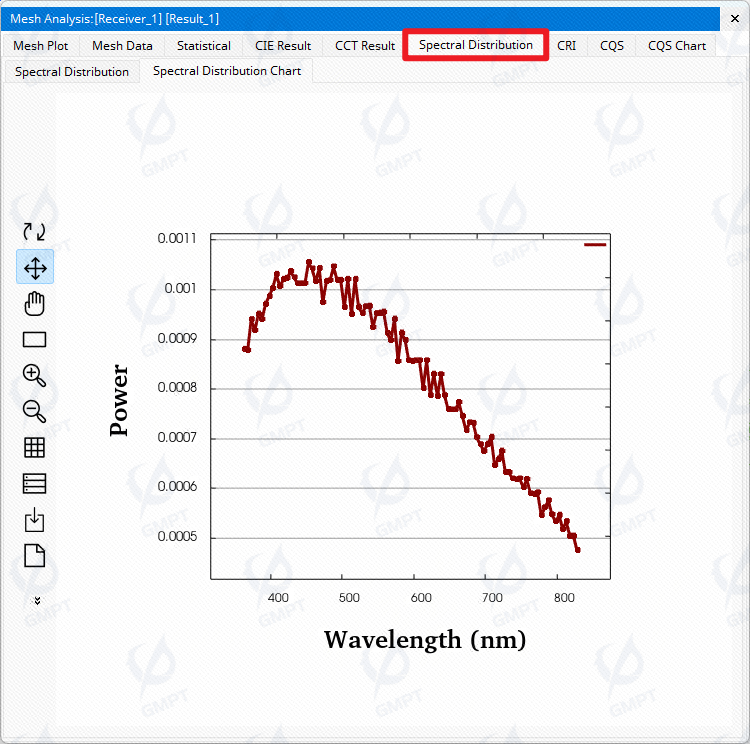
As shown, rays in this path form an image in front of the image plane, identifying it as a primary ghost image path. The maximum illuminance is 2.3‰ of the main path, with an energy contribution of 8.7‰. Although the path does not exhibit typical aberration trajectories, chromatic aberration may be present, which can be verified in spectral distribution analysis. For stray light reduction, a broadband anti-reflective coating should be considered.
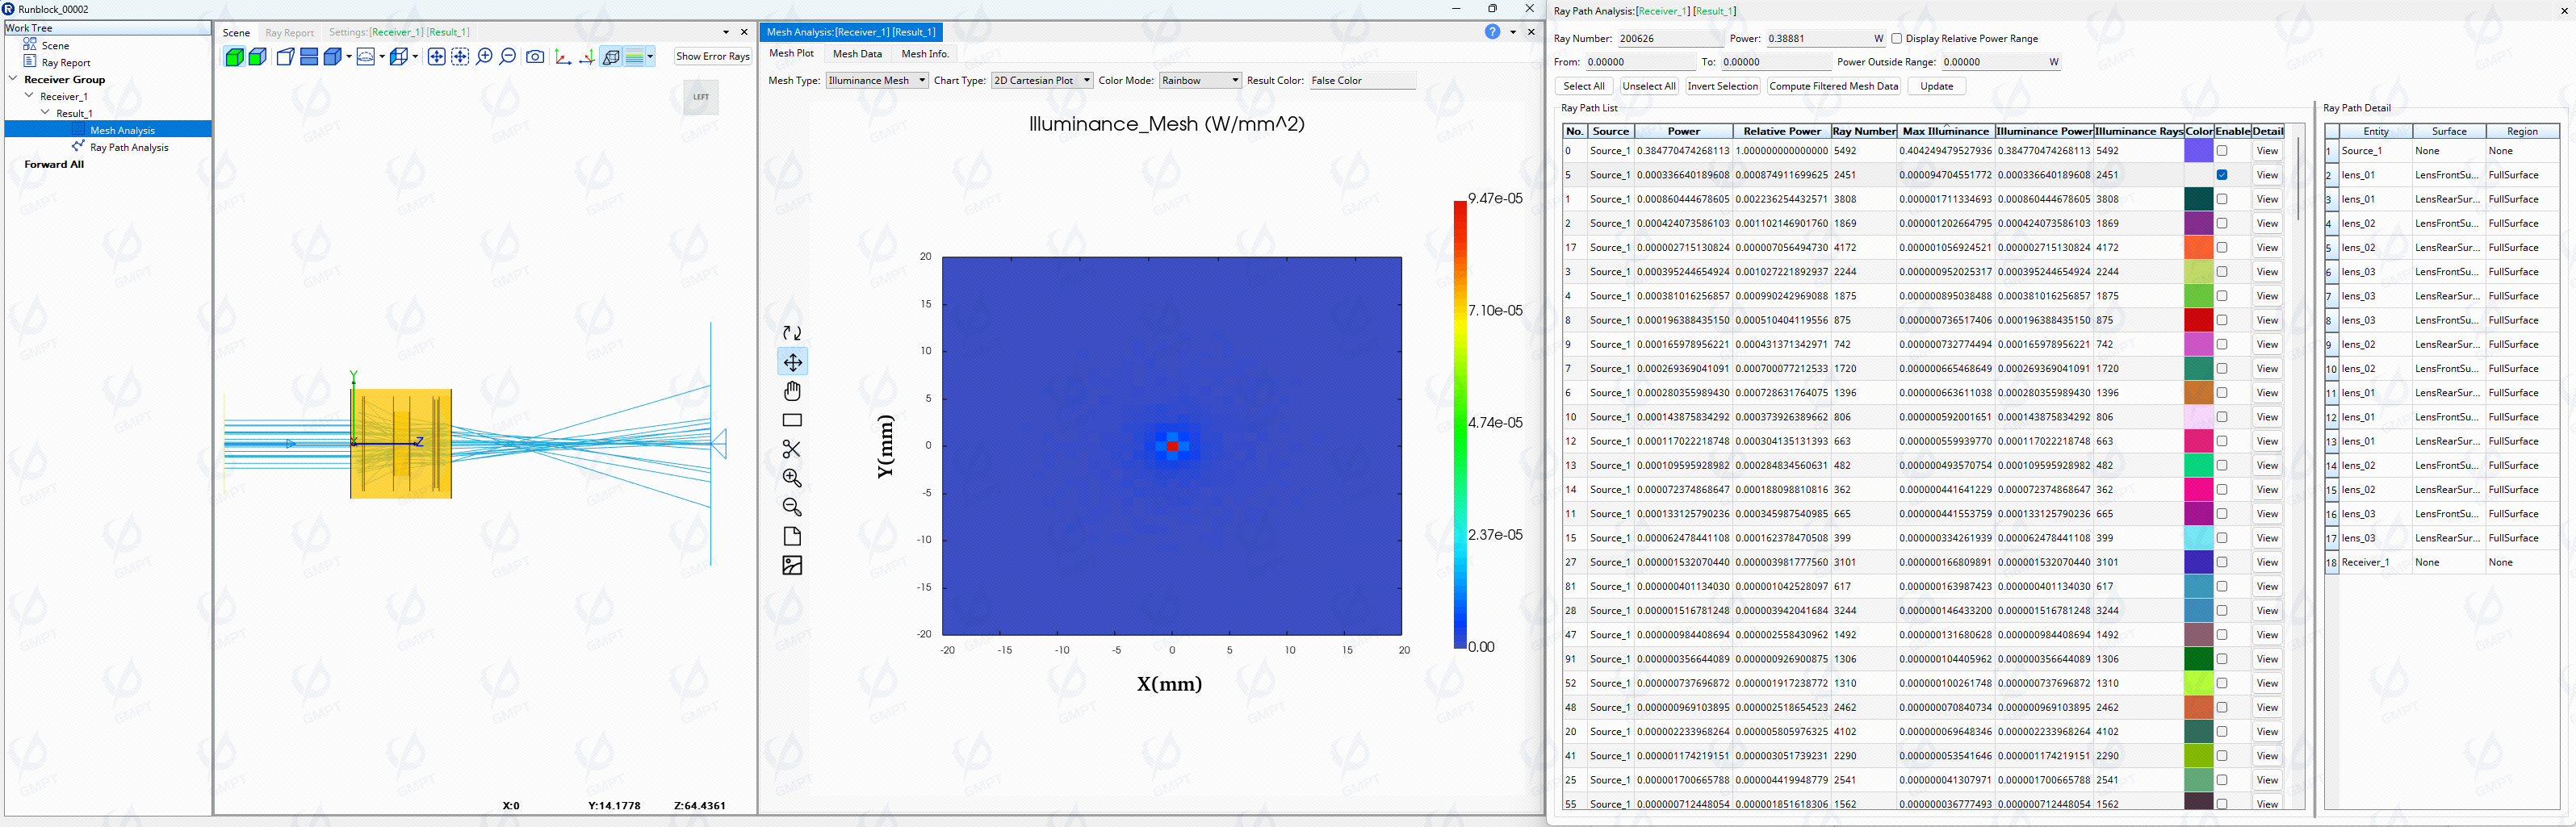
After identifying this ghost path, other ghost paths can be checked. By selecting all paths except the main path and the identified ghost path (the top two paths in maximum illuminance), the illuminance distribution on the receiver shows 210 paths with evenly distributed rays and no distinct image, contributing 9.2‰ of the main path energy.
Reducing Stray Light
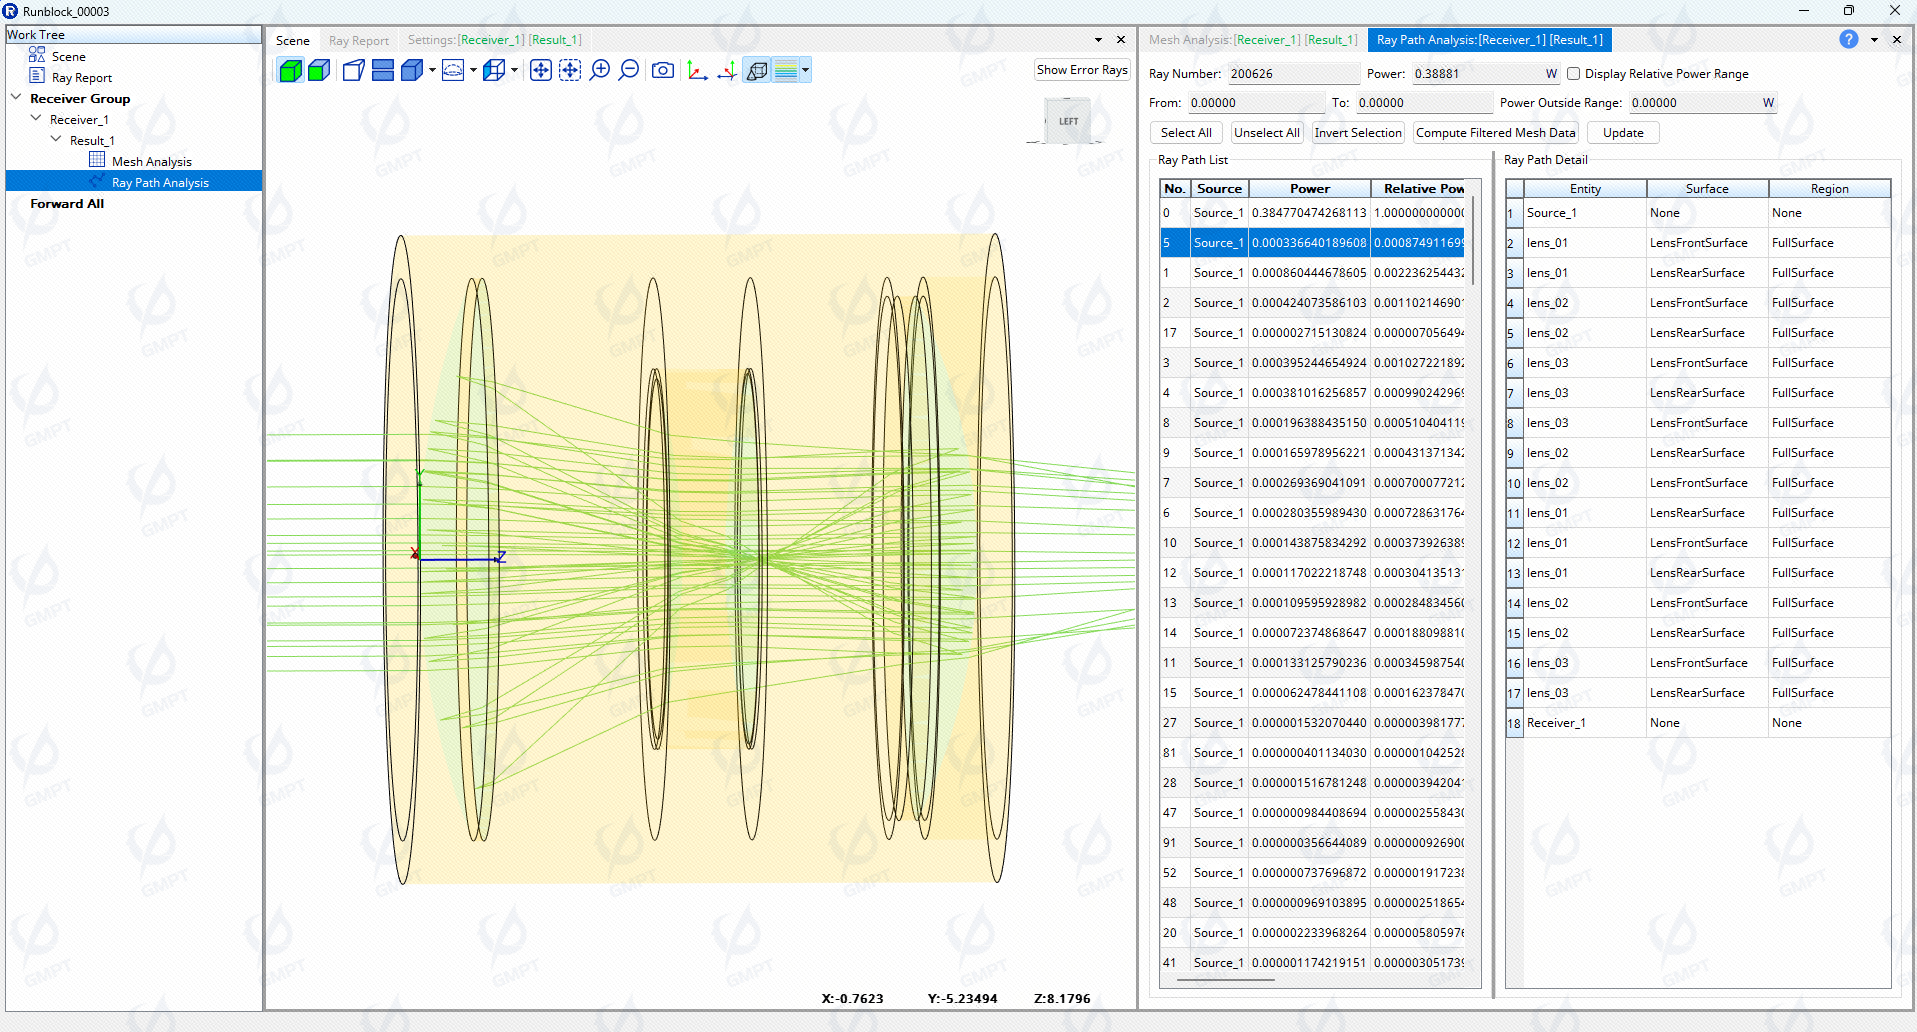
The identified ghost path, as shown, originates from the first reflection on the final surface of the main path. To reduce this reflection, apply a coating by changing the optical property from Fresnel reflection to ideal 100% transmission to simulate the coating effect. Rerun the simulation.
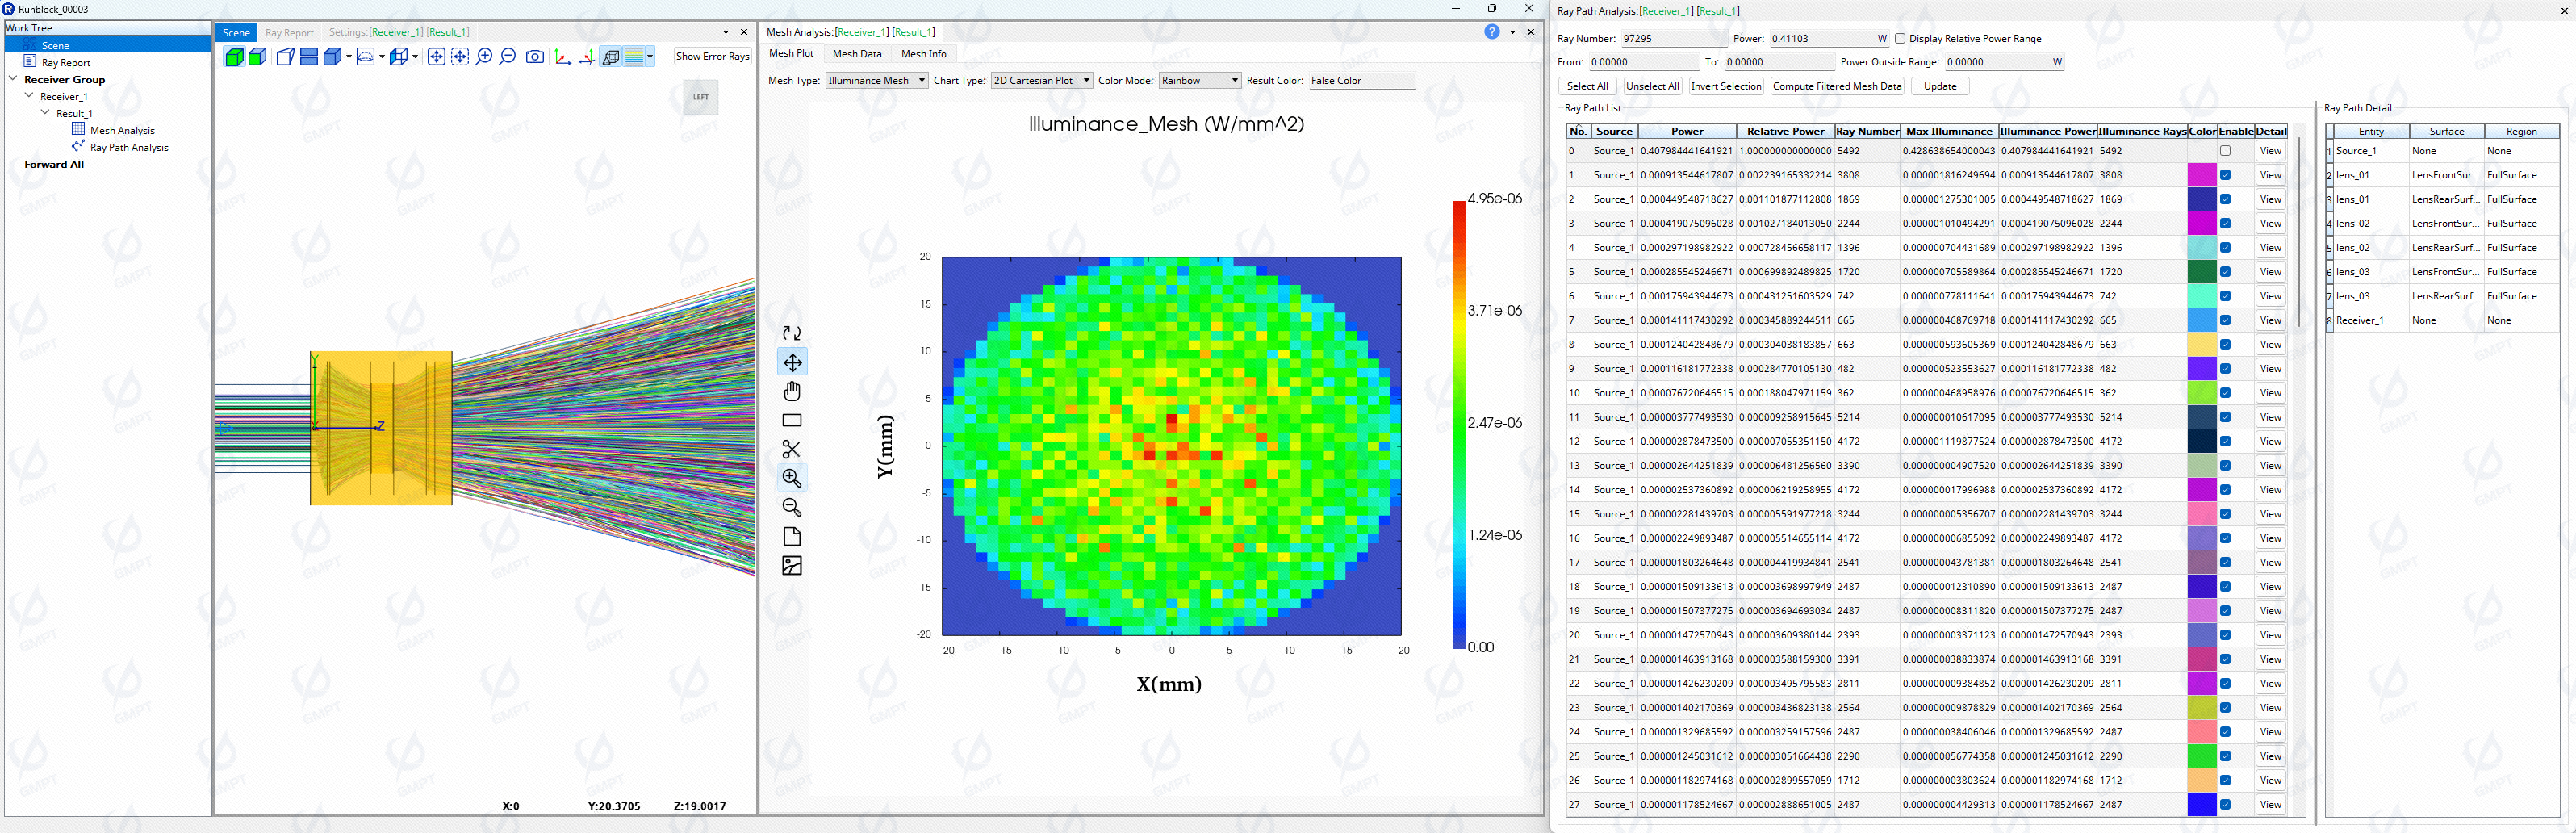
As shown, after coating, the number of optical paths reduces from 212 to 97, consistent with the exponential relationship between path count and surface count (100% transmission effectively blocks all paths that could reflect from this surface). Checking the illuminance distribution of all paths excluding the main path shows uniformly distributed rays with no distinct image, contributing 7.5‰ of the main path energy, indicating that the ghost image has been eliminated.
VI. Conclusion
This document outlines the complete simulation and analysis process for modeling and reducing stray light in Rayzen. The integration of functional modules within the software helps efficiently identify and analyze stray light sources and design solutions for stray light reduction. One key method for reducing stray light is coating design, and Rayzen supports the design and application of coatings, which will be covered in a dedicated topic with additional case studies.