Edge-Lit Backlight
GMPT
1. Background
Liquid Crystal Displays (LCDs) inherently lack the capability to emit light, necessitating backlight modules to provide adequate brightness and uniform illumination. Consequently, backlight modules have emerged as a critical component of LCD display panels.
These modules primarily consist of light sources, reflectors, light guide plates, diffusion films, brightness enhancement films, plastic frames, and other elements. Based on the arrangement of light sources, backlight modules are categorized into edge-lit and direct-lit types. Edge-lit configurations have progressively become predominant due to their ability to facilitate thinner backlight module designs.
The utilization of non-sequential optical simulation software is indispensable for ensuring that backlight modules deliver the requisite brightness distribution. This approach offers several advantages over traditional methods:
- Limitations of Trial-and-Error Methods: Traditional trial-and-error methodologies involve the fabrication and physical testing of prototypes, which can be prohibitively expensive, time-intensive, and lacking in flexibility. Each iteration necessitates the creation of new prototypes followed by actual testing to assess performance. However, this method is constrained by the need to remanufacture and retest with every modification or adjustment, leading to increased costs and extended development times.
- Advantages and Efficiency of Simulation Technology: Rayzen software provides an accurate and efficient means to simulate and analyze the optical behavior of display panels. It enables rapid ray tracing and interaction calculations between light and materials within a computational environment, obviating the need for physical manufacturing and testing. This allows designers to conduct numerous virtual experiments, exploring various design alternatives and parameter settings to optimize performance without the logistical challenges associated with physical prototyping.
- Proactive Problem Identification and Design Optimization: By simulating optical processes such as light propagation, refraction, and reflection, Rayzen aids in predicting and analyzing light distribution, color rendering, and other optical characteristics within display panels. This capability facilitates early identification and resolution of potential issues, thereby reducing the cost and time required for modifications and optimizations before entering the manufacturing phase.
- Visualization and Analysis Capabilities: Rayzen offers visual representations and generates data pertaining to light paths, intensity distributions, and color displays. This visualization enables designers to observe and analyze the optical effects of different design schemes, facilitating informed decision-making. Moreover, the software provides detailed data outputs and advanced analysis tools to support comprehensive performance evaluations and further optimization efforts.
2. Theoretical Analysis
2.1 Key Performance Indicators
In the display panel industry, several critical evaluation metrics are commonly employed to assess visual experience and performance. These include:
- Uniformity: Measures the consistency of light distribution across the display area.
- Brightness: Quantifies the intensity of light emitted from the display.
- Contrast Ratio: Evaluates the difference between the brightest white and the darkest black that can be displayed.
- Color Accuracy: Determines how faithfully the display reproduces colors compared to a standard color space.
- Viewing Angle: Specifies the range within which the display maintains acceptable brightness, contrast, and color accuracy.
Among these metrics, uniformity and brightness are predominantly influenced by the backlight module, which plays a pivotal role in ensuring optimal display performance.
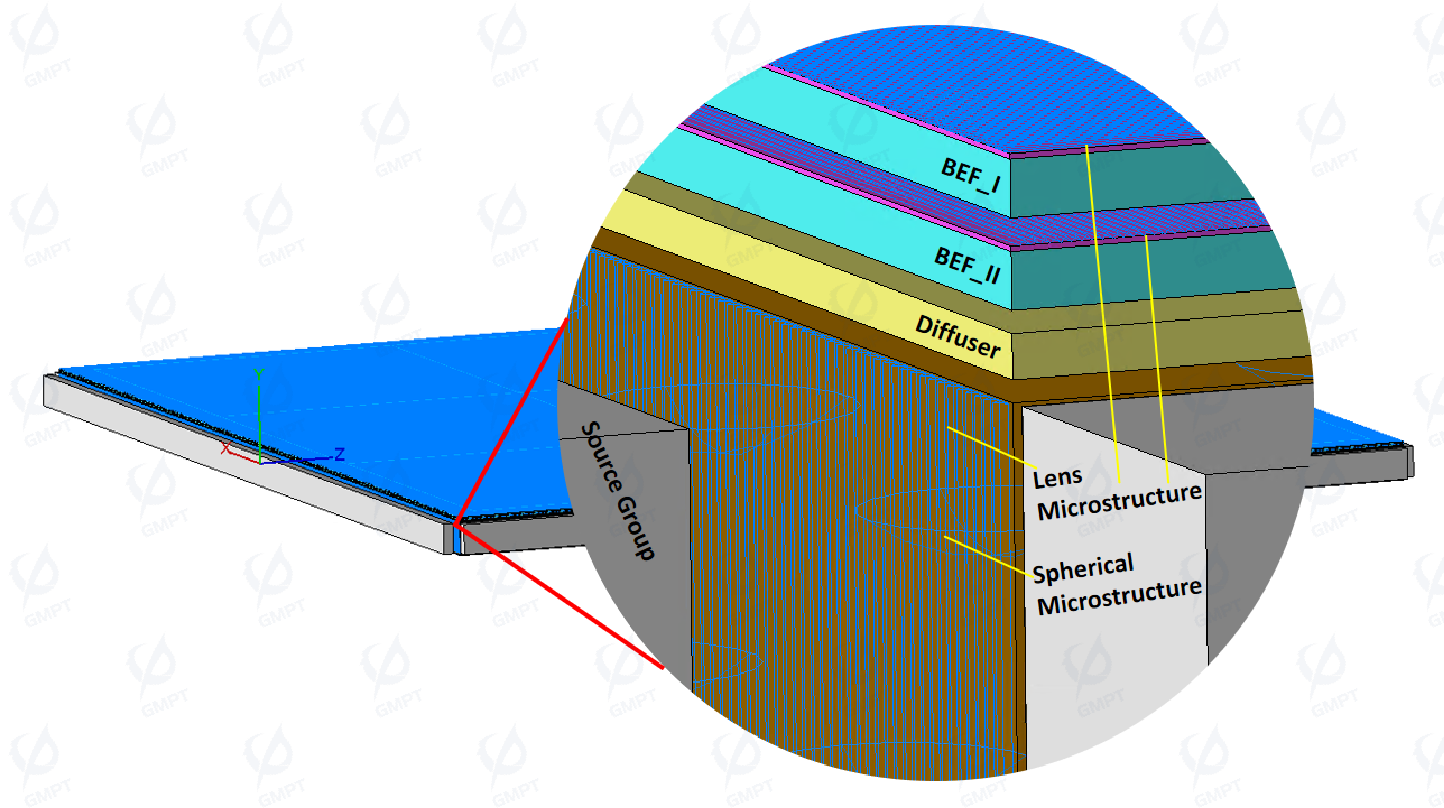
2.2 Functionality of the Light Guide Plate
The light guide plate (LGP) is a crucial component within the backlight module, designed to transform point or linear light sources into a uniform surface light source. This transformation is achieved through the strategic arrangement of specific microstructures on the LGP. These microstructures facilitate the redirection of light via mechanisms such as total internal reflection and diffuse reflection. By manipulating the path of light rays, the LGP ensures that the light emitted from the desired area aligns with the designer's specifications, thereby converting the input light into an evenly distributed surface illumination. This process is essential for achieving high levels of uniformity and brightness, key factors in delivering superior visual quality in display panels.
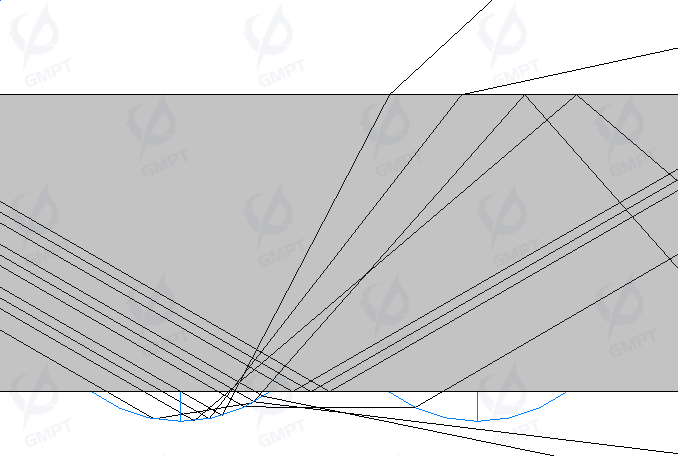
While the light guide plate (LGP) plays a critical role in converting point or linear light sources into a surface light source, relying solely on the LGP is insufficient to meet the stringent industry requirements for uniformity. The microstructures on the LGP, which are designed to redirect light through total internal reflection and diffuse reflection, can introduce localized variations in light distribution. These microstructural features may result in specific regions of brightness and darkness, forming distinct bright areas, dark lines, or light spots across the display surface.
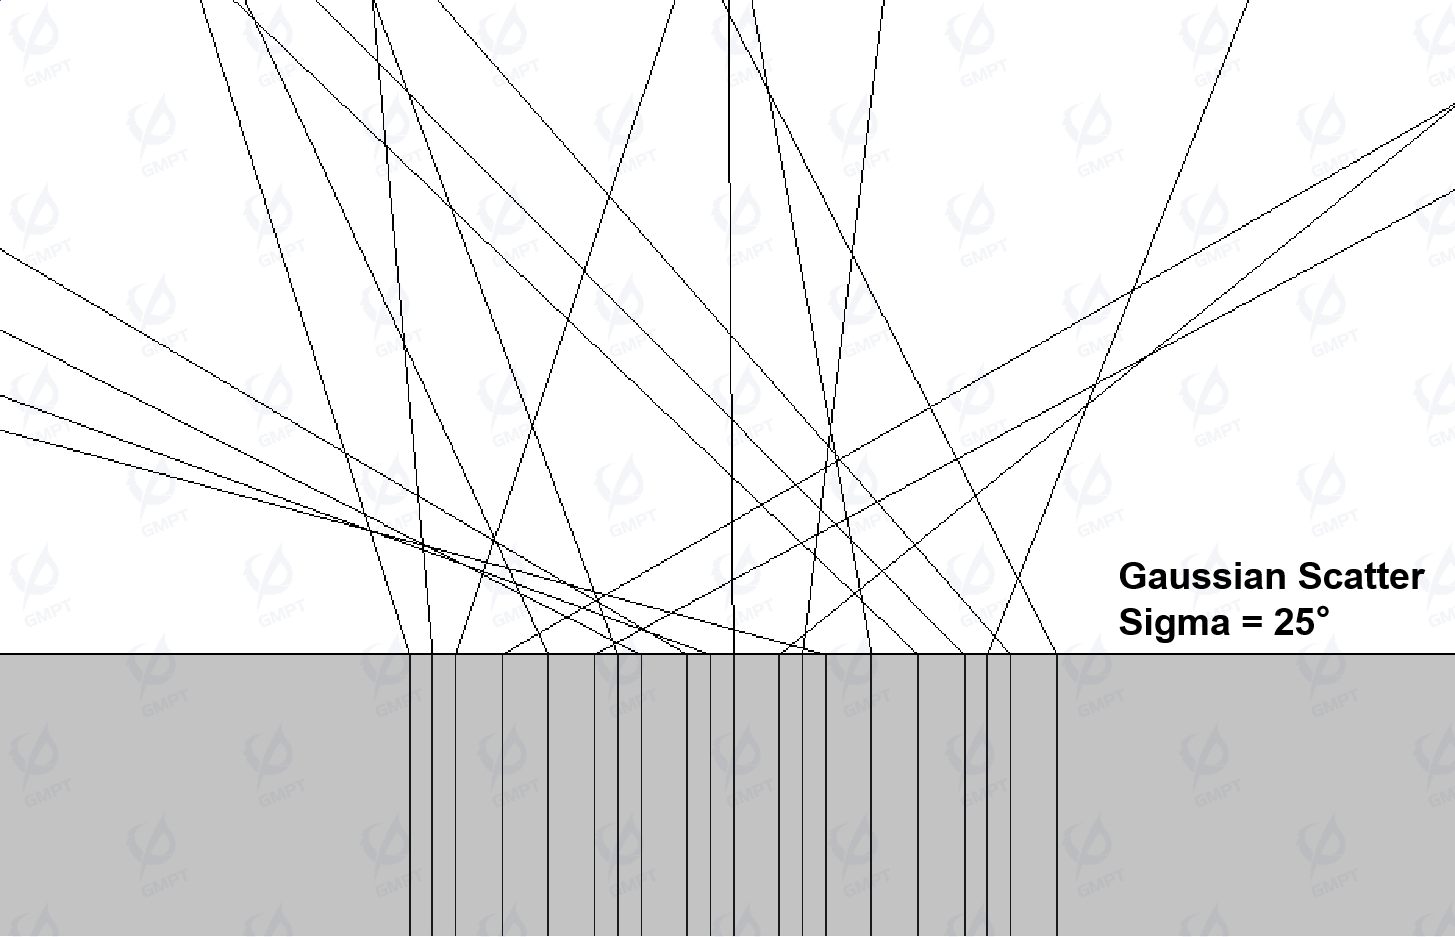
To address these inconsistencies and achieve a more uniform light distribution, it is necessary to incorporate a diffusion film within the backlight module. The diffuser serves to further homogenize the emitted light, effectively mitigating the localized variations caused by the LGP's microstructures. By scattering the light rays, the diffuser ensures a more even distribution of light intensity across the entire display area, thereby enhancing uniformity and overall visual quality.
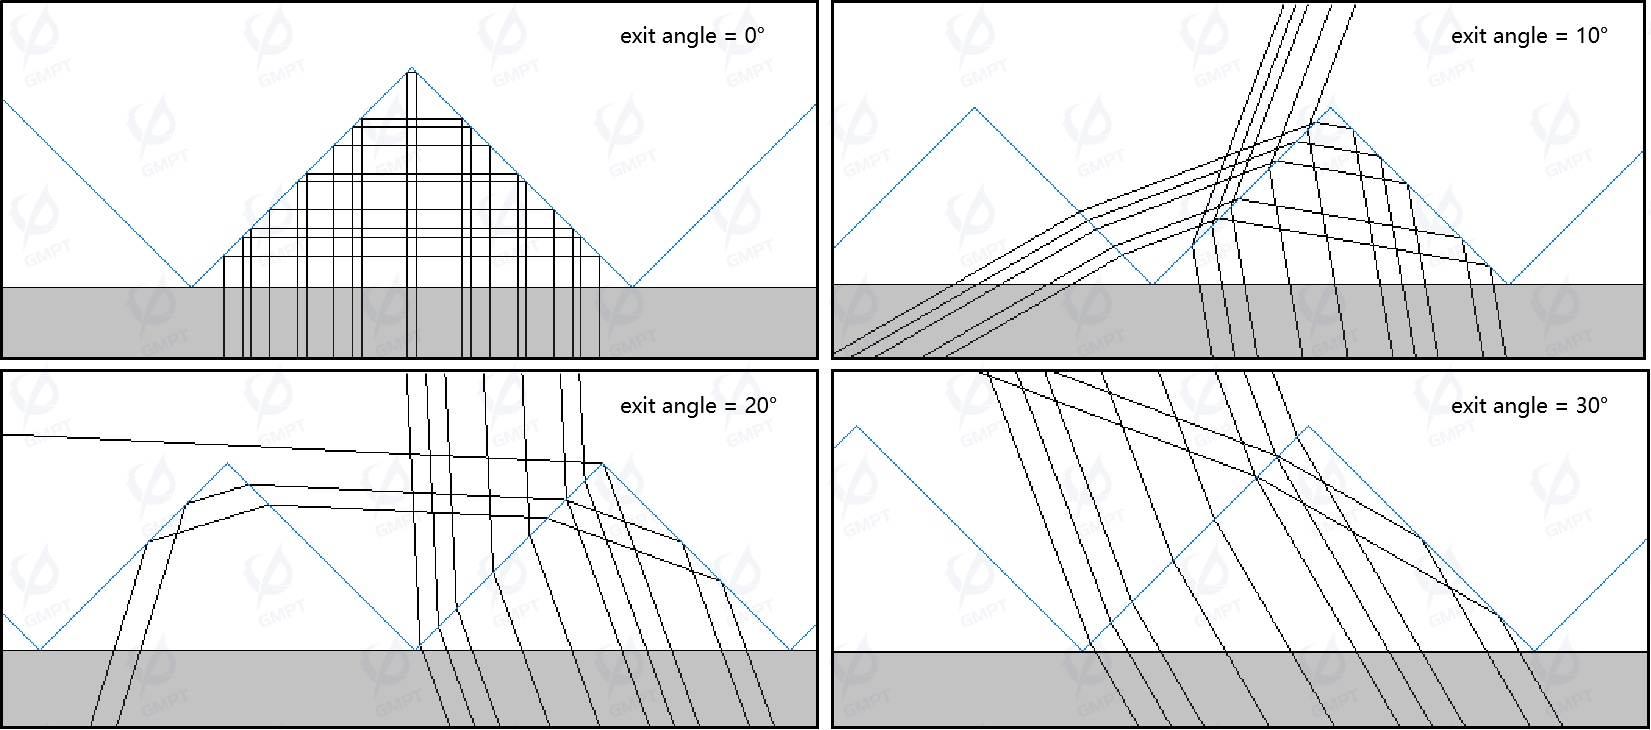
If the angular distribution of emitted light is excessively broad, it can significantly diminish display brightness. Therefore, under the constraint of meeting specific viewing angle requirements, it is essential to concentrate the angular distribution of light as much as possible. This concentration ensures that only light within the desired angular range contributes to the display's luminance, thereby enhancing overall brightness.
To achieve this optimization, microstructures with specific parameters and arrangements are designed on transparent materials. These microstructures function to confine the light paths by leveraging total internal reflection. Consequently, light rays emitted at large angles are blocked, while only those within the specified angular range are permitted to exit the material. This selective emission enhances the efficiency of light utilization, leading to improved display brightness.
3. Software Features Wupport
As mentioned above, designing backlight modules in Rayzen requires some professional geometric tools to support modeling and rendering of tens of thousands of microstructures with different shapes and positions; And some specific lighting analysis methods and techniques for checking the performance of backlight systems
We will demonstrate Rayzen's support for the following features in the following backlight simulation examples:
- Practical modeling methods and examples of using 3D textures for lighting on a light guide plate;
- Modeling method for Brightness Enhancement Films (BEFs);
- Set material and optical properties to appropriately simulate the scattering behavior of light by reflective plates, diffusion films, plastic frames, etc;
- Use illuminance, intensity, and brightness analysis to check the performance of the backlight module.
4. Simulation configuration
In this case, all optical components are rectangular or rectangular structures, with specific parameters shown in the table below and length units in millimeters.
4.1 Optical Components:
| Components | L | W | H | (x, y, z, α, β, γ) | Material(n, k) | Optical Properties |
|---|---|---|---|---|---|---|
| BEF_I_Prism | 100 | 100 | 0.012 | (50, 2.0330, 50, 0, 90, 0) | (1.590, 0) | Fresnel_Probabilistic |
| BEF_I_Substrate | 100 | 100 | 0.127 | (50, 1.9635, 50, 0,90, 0) | (1.667, 0) | Fresnel_Probabilistic |
| BEF_II_Prism | 100 | 100 | 0.012 | (50, 1.8330, 50, 0, 0, 0) | (1.590, 0) | Fresnel_Probabilistic |
| BEF_II_Substrate | 100 | 100 | 0.127 | (50, 1.7635, 50, 0, 0, 0) | (1.667, 0) | Fresnel_Probabilistic |
| Diffuser | 100 | 100 | 3 | (0, 1.6, 0, 0, 0, 0) | air | 100%Transmittance TopSurface:BSDF Data |
| Lightguide | 100 | 100 | 3 | (0, 0, 0, 0, 0, 0) | PMMA | Fresnel_Probabilistic |
| Reflector | 100 | 100 | 0.1 | (0, -1.7, 0, 0, 0, 0) | PMMA | 100%Reflectance |
| BLUFrame_Top | 1 | 100 | 3 | (0.00, 0, 100.05, 0, 0, 0) | PMMA | Gaussian_Scatter: Ray Treatment: Reflected Weighted Rays: No Energy Conservation: Yes Reflectance: 85% Radius: 15° |
| BLUFrame_Bottom | 1 | 100 | 3 | (0.00, 0,-1.75, 0, 0, 0) | PMMA | |
| BLUFrame_Left | 1 | 100 | 3 | (50.05, 0, 50.00, 0, -90, 0) | PMMA | |
| BLUFrame_Right | 1 | 100 | 3 | (-50.05, 0, 50.00, 0, 90, 0) | PMMA |
there are additional microstructure settings at the bottom and left of the light guide plate, as well as at the top of the two sets of brightening films. The specific parameters are shown in the table below
4.2 Microstructure:
| 1 | 2 | 3 | 4 | |
|---|---|---|---|---|
| Location | Lightguide->BottomSurface | Lightguide->LeftSurface | BEF_II_Prism->TopSurface | BEF_I_Prism->TopSurface |
| Region | ||||
| Placement | Rectangular | Rectangular | Rectangular | Rectangular |
| Length | 100 | 100 | 100 | 100 |
| Width | 100 | 3 | 100 | 100 |
| Origin X | 0 | 0 | 0 | 0 |
| Origin Y | 0 | 0 | 0 | 0 |
| Rotation Angle | 0 | 0 | 0 | 0 |
| Texture | ||||
| Shape | Spherical Cap | Prism | Prism | Prism |
| Concavity | Convex | Convex | Convex | Convex |
| Radius | 0.5 | ---- | ---- | ---- |
| X_Width | ---- | 0.05 | 0.024 | 0.024 |
| Y_Width | ---- | 2.99 | 100 | 100 |
| Height | 0.1 | 0.025 | 0.012 | 0.012 |
| Angle_1 | ---- | 45 | 45 | 45 |
| Angle_2 | ---- | 45 | 45 | 45 |
| Theta | ---- | 0 | 0 | 0 |
| Arrangement | ||||
| Type | Rectangular | Rectangular | Rectangular | Rectangular |
| Spacing X | 1.5 | 0.05 | 0.024 | 0.024 |
| Spacing Y | 1.5 | 100 | 100 | 100 |
| Offset X | 0 | 0 | 0 | 0 |
| Offset Y | 0 | 0 | 0 | 0 |
4.3 Sources and Receiver:
| Components | L | W | (x, y, z, α, β, γ) | Additional Settings |
|---|---|---|---|---|
| SurfaceSource_1 | 2 | 2 | (-40, 0, -0.1, 0, 0, 0) | Angular Distribution: Uniform Angle From:0 Angle to:90 Spectrum: Spectrum Data |
| SurfaceSource_2 | 2 | 2 | (-20, 0, -0.1, 0, 0, 0) | |
| SurfaceSource_3 | 2 | 2 | (0, 0, -0.1, 0, 0, 0) | |
| SurfaceSource_4 | 2 | 2 | (20, 0, -0.1, 0, 0, 0) | |
| SurfaceSource_5 | 2 | 2 | (40, 0, -0.1, 0, 0, 0) | |
| PlaneReceiver | 95 | 95 | (0, 2.1, 50, 90, 0, 0) | ---- |
Tips: In the context of the aforementioned simulation settings, Rayzen's built-in CAD shortcut operations can significantly streamline the modeling process. The brightening film (BEF) is composed of two primary layers: a microstructure layer (Prism) and a substrate layer (Substrate), which are ensured intimate contact between their surfaces by clicking 'connect' button ![]() available in the CAD toolbar. While the geometric and microstructural parameters of the two brightening films (BEF-I and BEF-II) are identical, they differ only in overall offset and rotation.
available in the CAD toolbar. While the geometric and microstructural parameters of the two brightening films (BEF-I and BEF-II) are identical, they differ only in overall offset and rotation.
To efficiently model these components:
Configuration of BEF-I:
- Complete the material, optical properties, and geometric settings for the first brightening film (BEF-I).
Replication of BEF-I to BEF-II:
- Utilize the "Copy to" button
 available in the CAD toolbar to duplicate the entire connected group of BEF-I to the position designated for BEF-II. This ensures that all parameter settings are accurately transferred while allowing for necessary adjustments in position and orientation.
- Utilize the "Copy to" button
Implementation of Backlight Unit Frame:
- Similarly, after configuring the top frame, the same "Copy to" function can be employed to quickly create the bottom, left, and right Frame.
- For the five light sources, this method also facilitates rapid replication and placement, ensuring consistency and efficiency in the design process.
By leveraging Rayzen’s CAD shortcut operations, the modeling process becomes more efficient and precise, reducing the potential for errors and minimizing the time required for detailed configuration. This approach not only enhances productivity but also maintains high standards of accuracy in the simulation setup.
5. Simulation Result
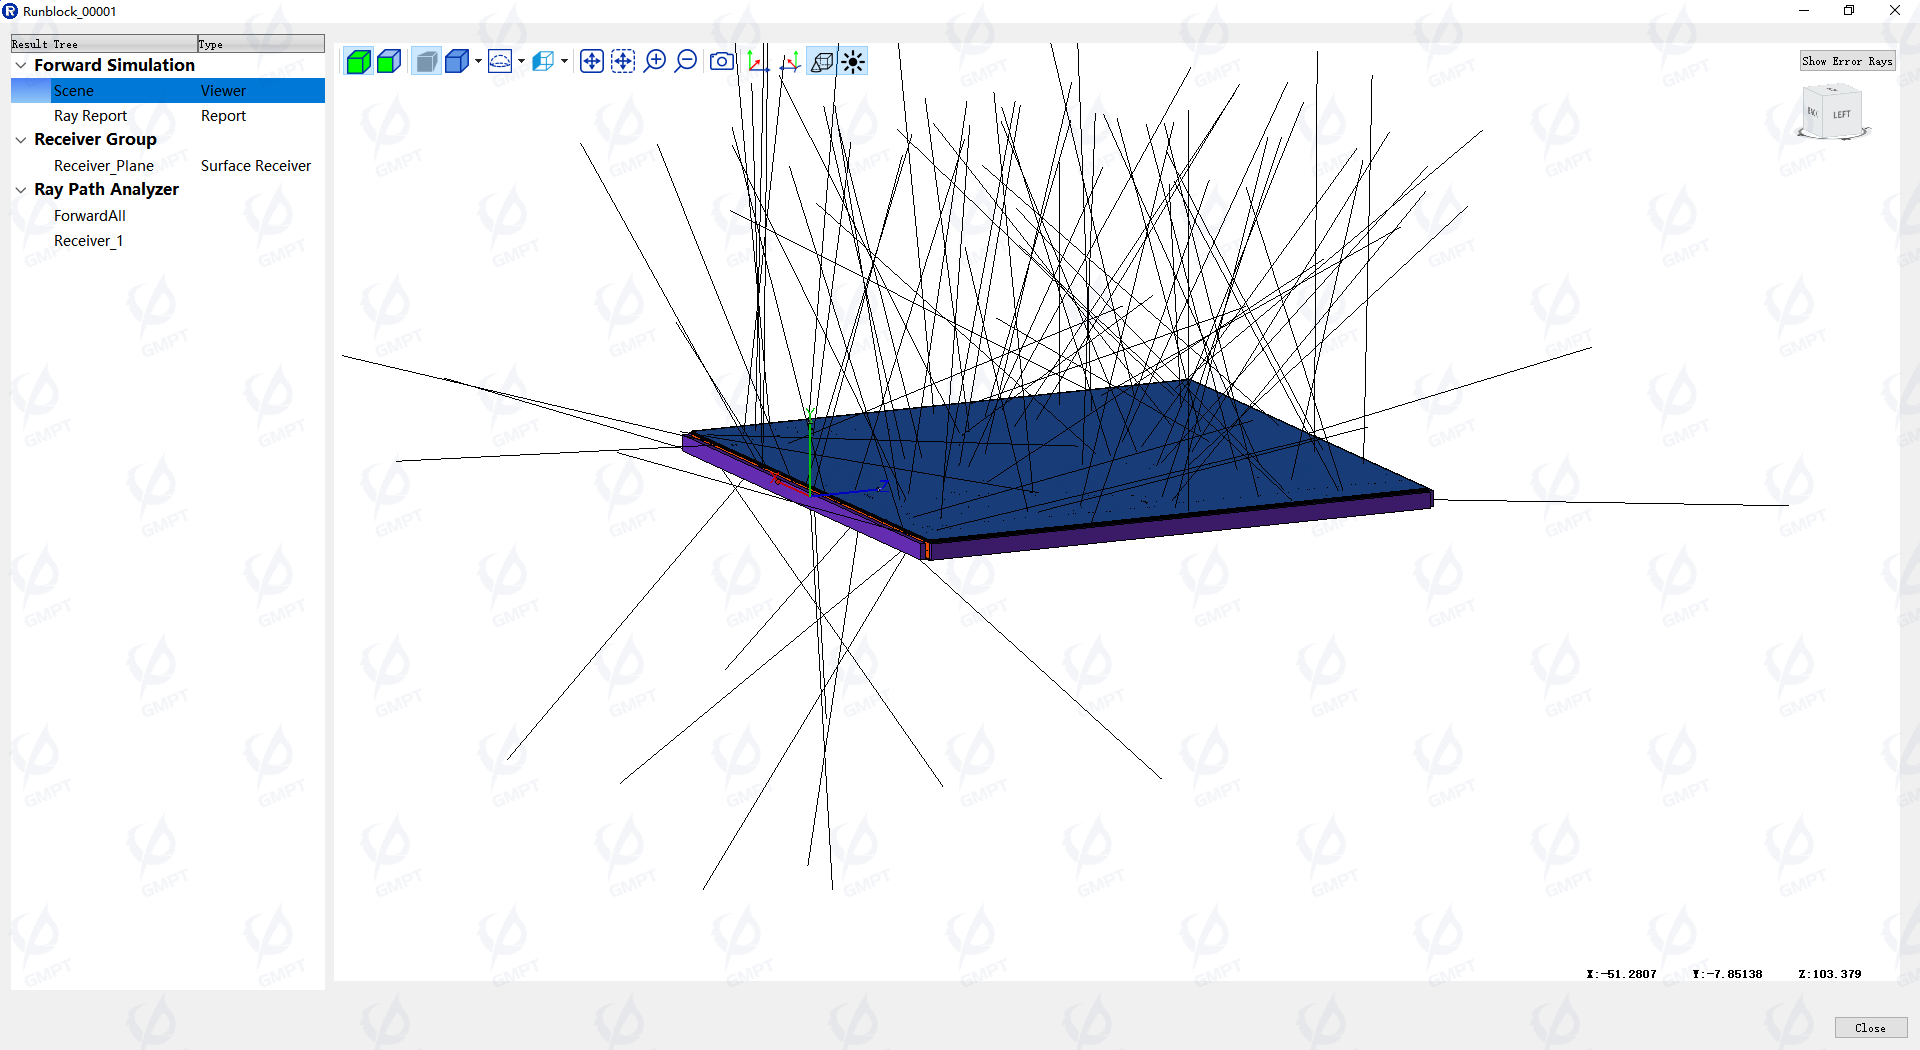
We set the number of simulated rays to 1,000,000, and after raytracing, the preview of the rays in the scene is shown in the following figure
5.1 Grid Density v.s. Ray Number
In the post-processing module, grid density adjustment is crucial for optimizing both resolution and accuracy. The relationship between grid density and ray number in each grid directly impacts the quality of the simulation results. Specifically: higher grid density corresponds to increased resolution, providing finer detail in the simulation output. Conversely, lower grid density reduces resolution but icreases the number of rays allocated per grid and improves accuracy, as it better represents the statistical behavior of light propagation.
The evaluation of Monte Carlo simulation results involves a trade-off between resolution and accuracy. According to statistical theory, the accuracy of Monte Carlo results converges to , where is the number of rays in a single grid. This implies that increasing the number of rays per grid enhances accuracy, albeit with diminishing returns.
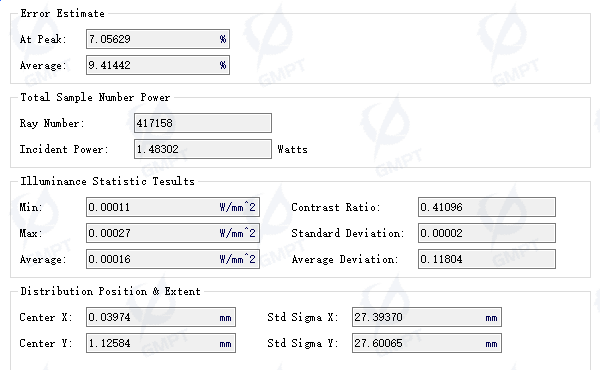
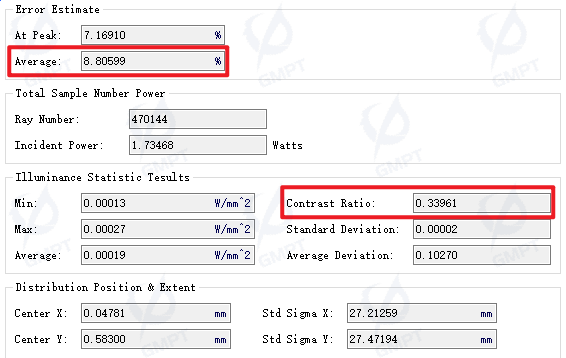
For backlight module simulations, key analysis indicators include illumination uniformity, intensity, and brightness distribution on the receiver. In this context, minimizing the Mean Error and Contrast Ratio , is critical for achieving optimal simulation outcomes. A smaller Mean Error and Contrast Ratio indicate superior uniformity and performance.
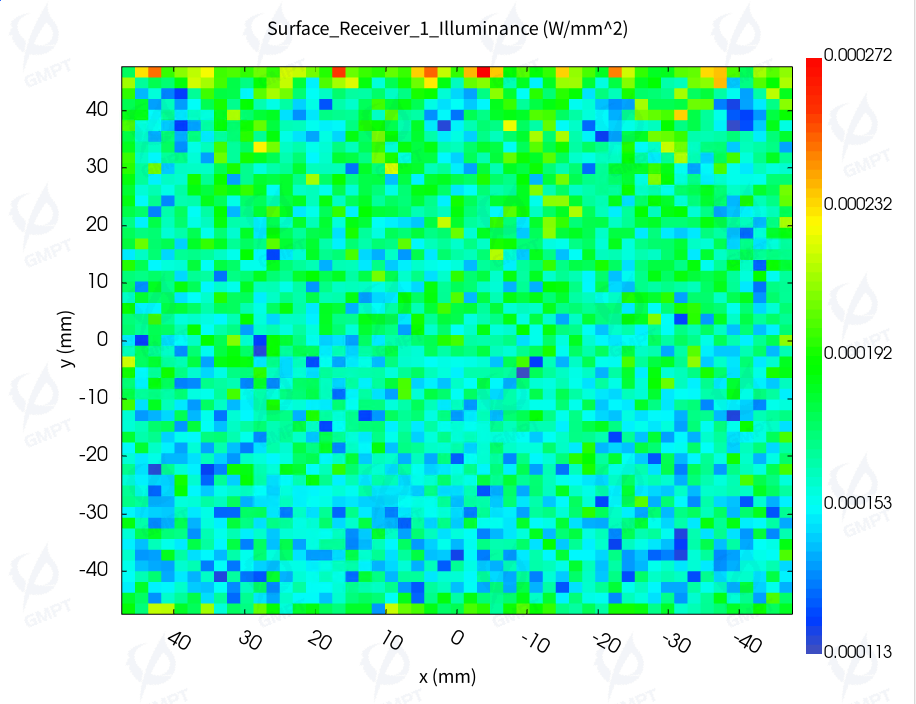
To ensure that the average error does not exceed 10%, we partitioned the illuminance grid accordingly. The resulting illuminance distribution and statistical analysis are illustrated in the following figure:
 |  |
5.2 Bezier Arrangment for better uniformity
Given the slightly smaller dimensions of the receiver (95 mm × 95 mm) relative to the panel (100 mm × 100 mm), we have disregarded the minor light leakage caused by the gap between the light source and the light guide plate. Initial observations revealed that, due to the uniform distribution of microstructures at the bottom of the light guide plate, lighting efficiency was higher in proximity to the light source but diminished progressively with distance from it.
To address this issue, we implemented a Bezier layout strategy to reduce the density of microstructures near the light source. This approach aims to optimize the spatial distribution of microstructures, thereby enhancing illumination uniformity across the entire surface. After rerunning the simulation with this modified layout, the resulting illuminance distribution and statistical analysis are presented in the following figure:
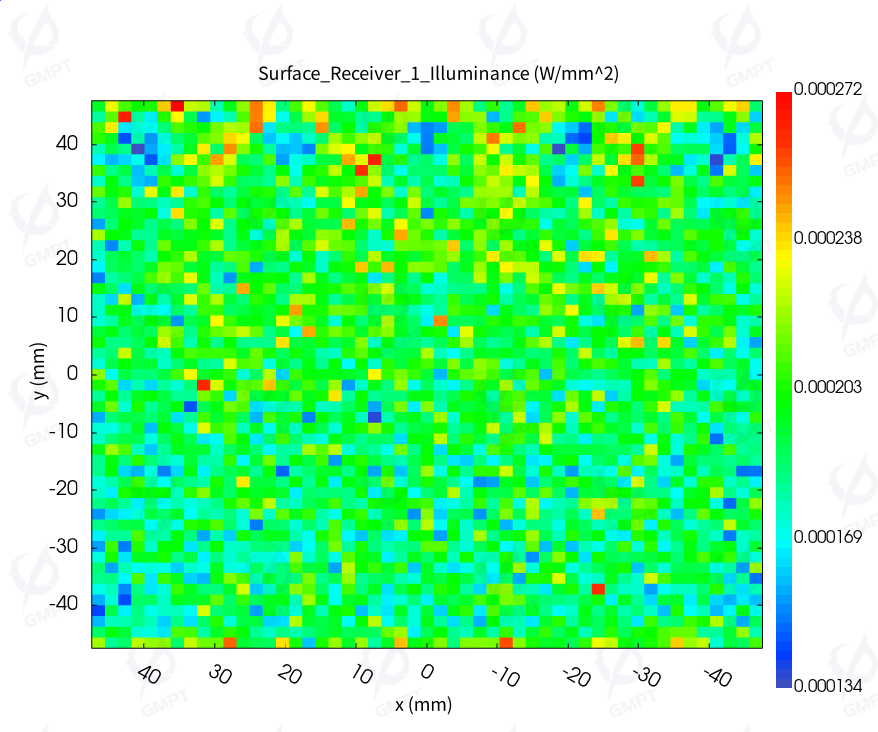 |  |
The analysis indicates a reduction in both the average error and contrast ratio, suggesting an improvement in lighting uniformity and overall performance. Specifically, the optimization through Bezier layout has mitigated the decline in lighting efficiency away from the light source, leading to more consistent illuminance across the receiver area.