Nuwa TCAD
Analyze the internal physical mechanisms of semiconductor devices, optimize process and device design, and improve the performance, product development efficiency, and yield of semiconductor devices.
Features > Efficiency Features > Plot Center
- Features
- Process Simulation
- Efficiency Features
Plot Center
GMPT, October 2024
The plot center is an important component of the simulation tool, primarily used for processing and analyzing simulation result data. The plot center of the Nuwa TCAD simulation tool provides functionalities such as result visualization, data processing and extraction, and result comparison. It transforms simulation results into formats that assist engineers in further analysis, playing a crucial role in device simulation and mechanism analysis.
Functions
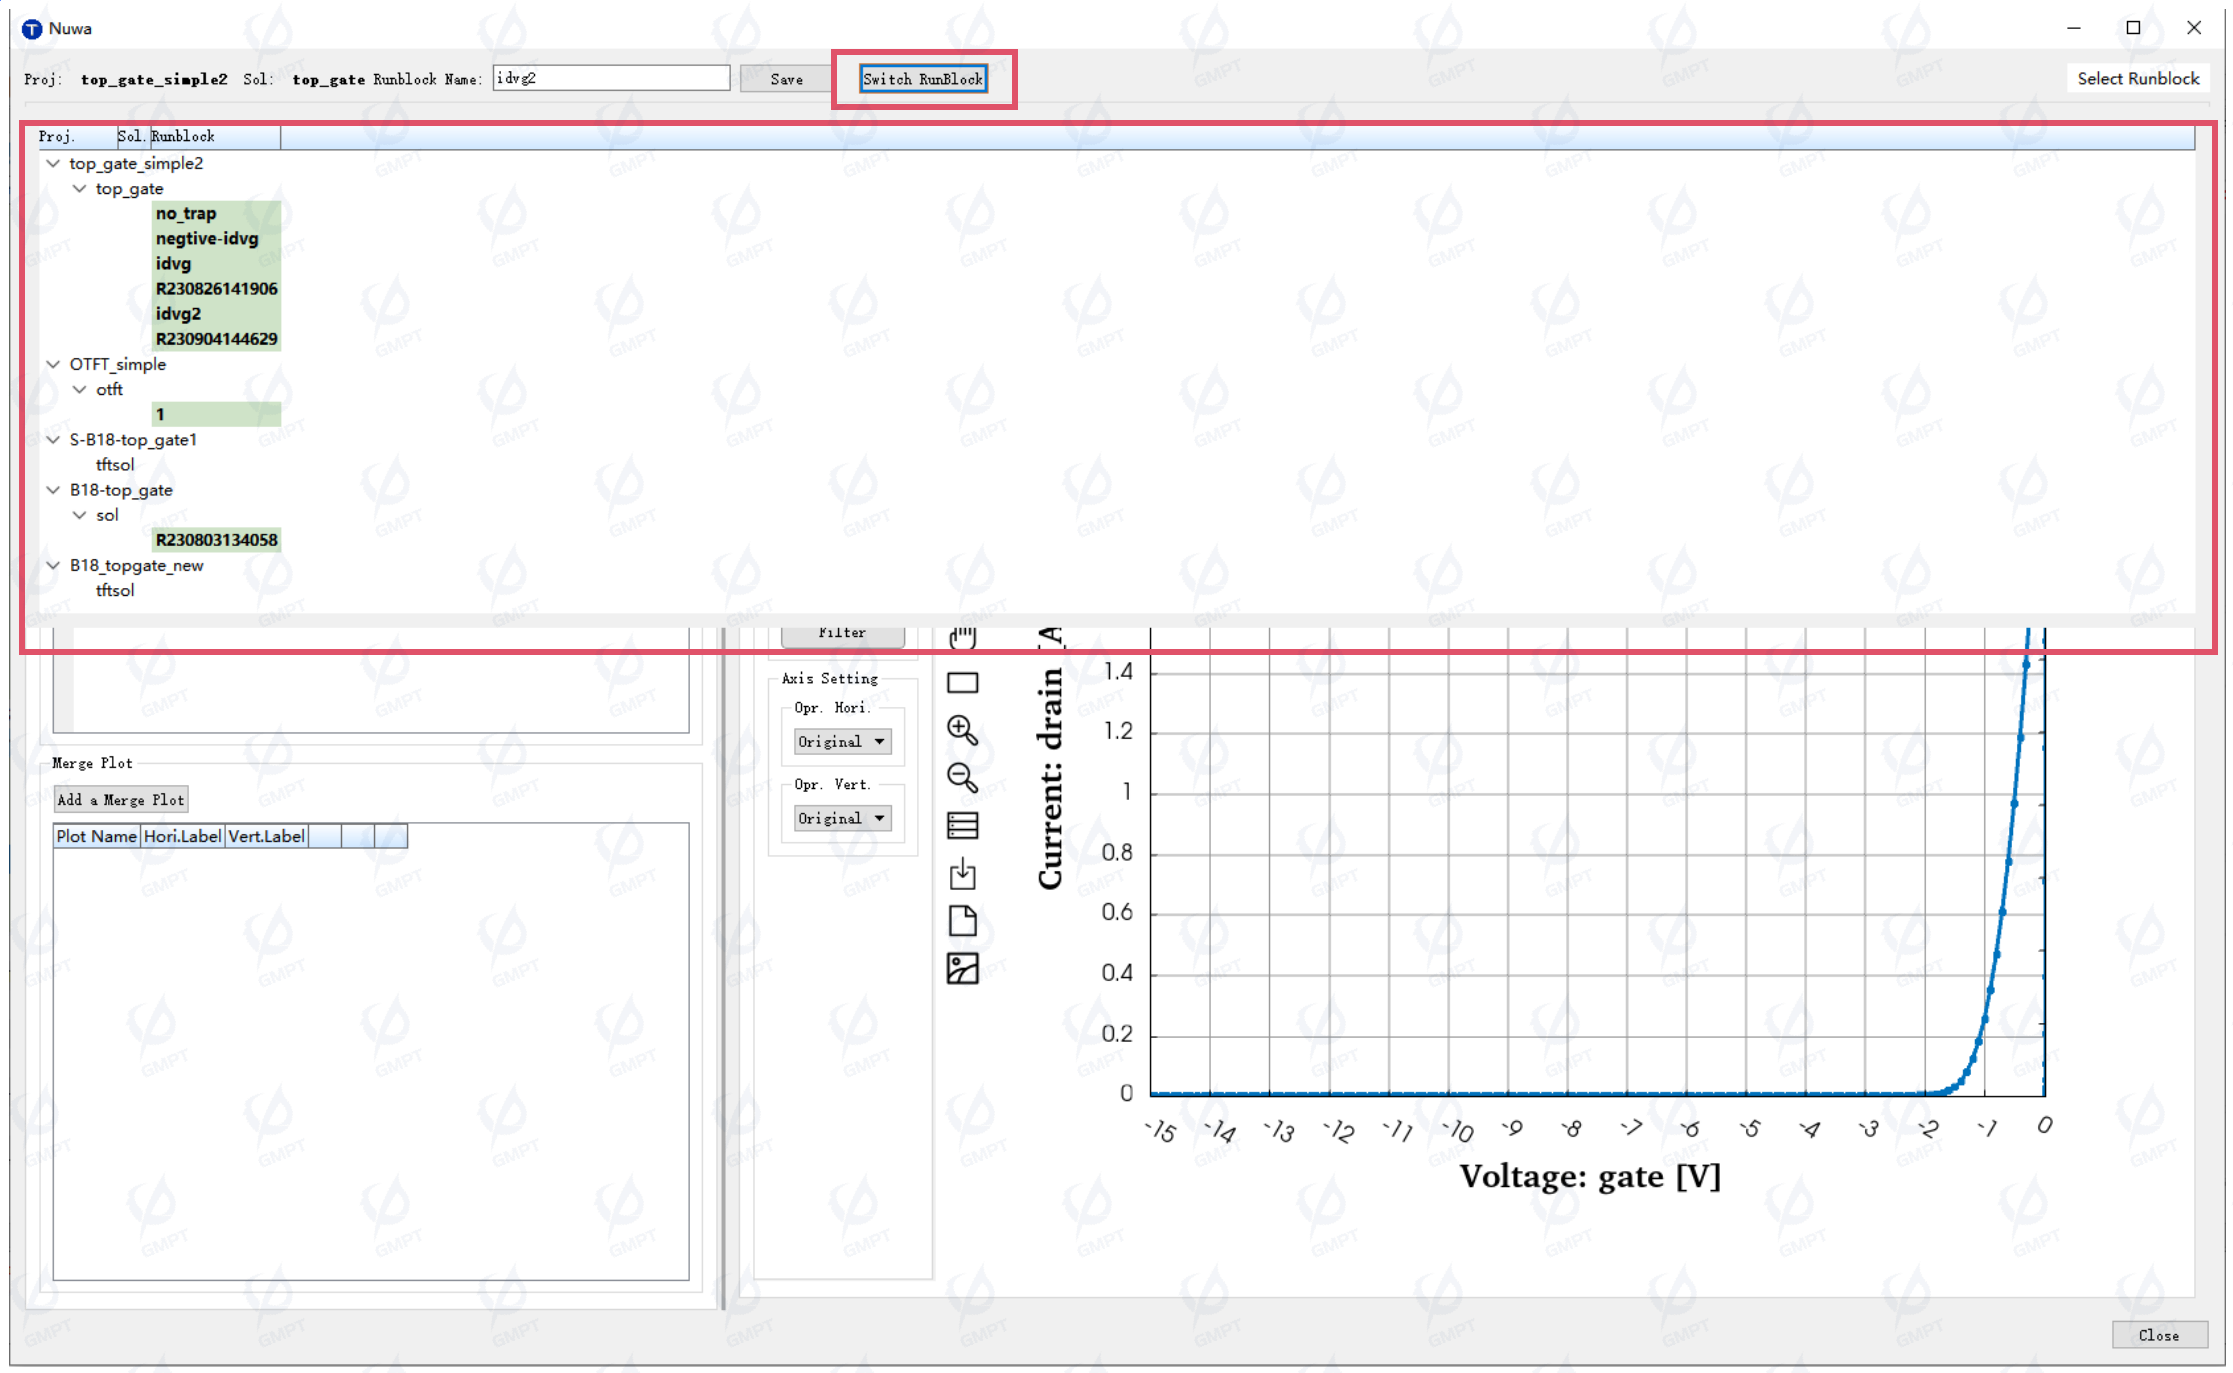
Quick Runblock Switch
- Supports quick switching between Runblocks, making it convenient for users to view simulation results.
- Supports quick switching between Runblocks, making it convenient for users to view simulation results.
Profile Plotting
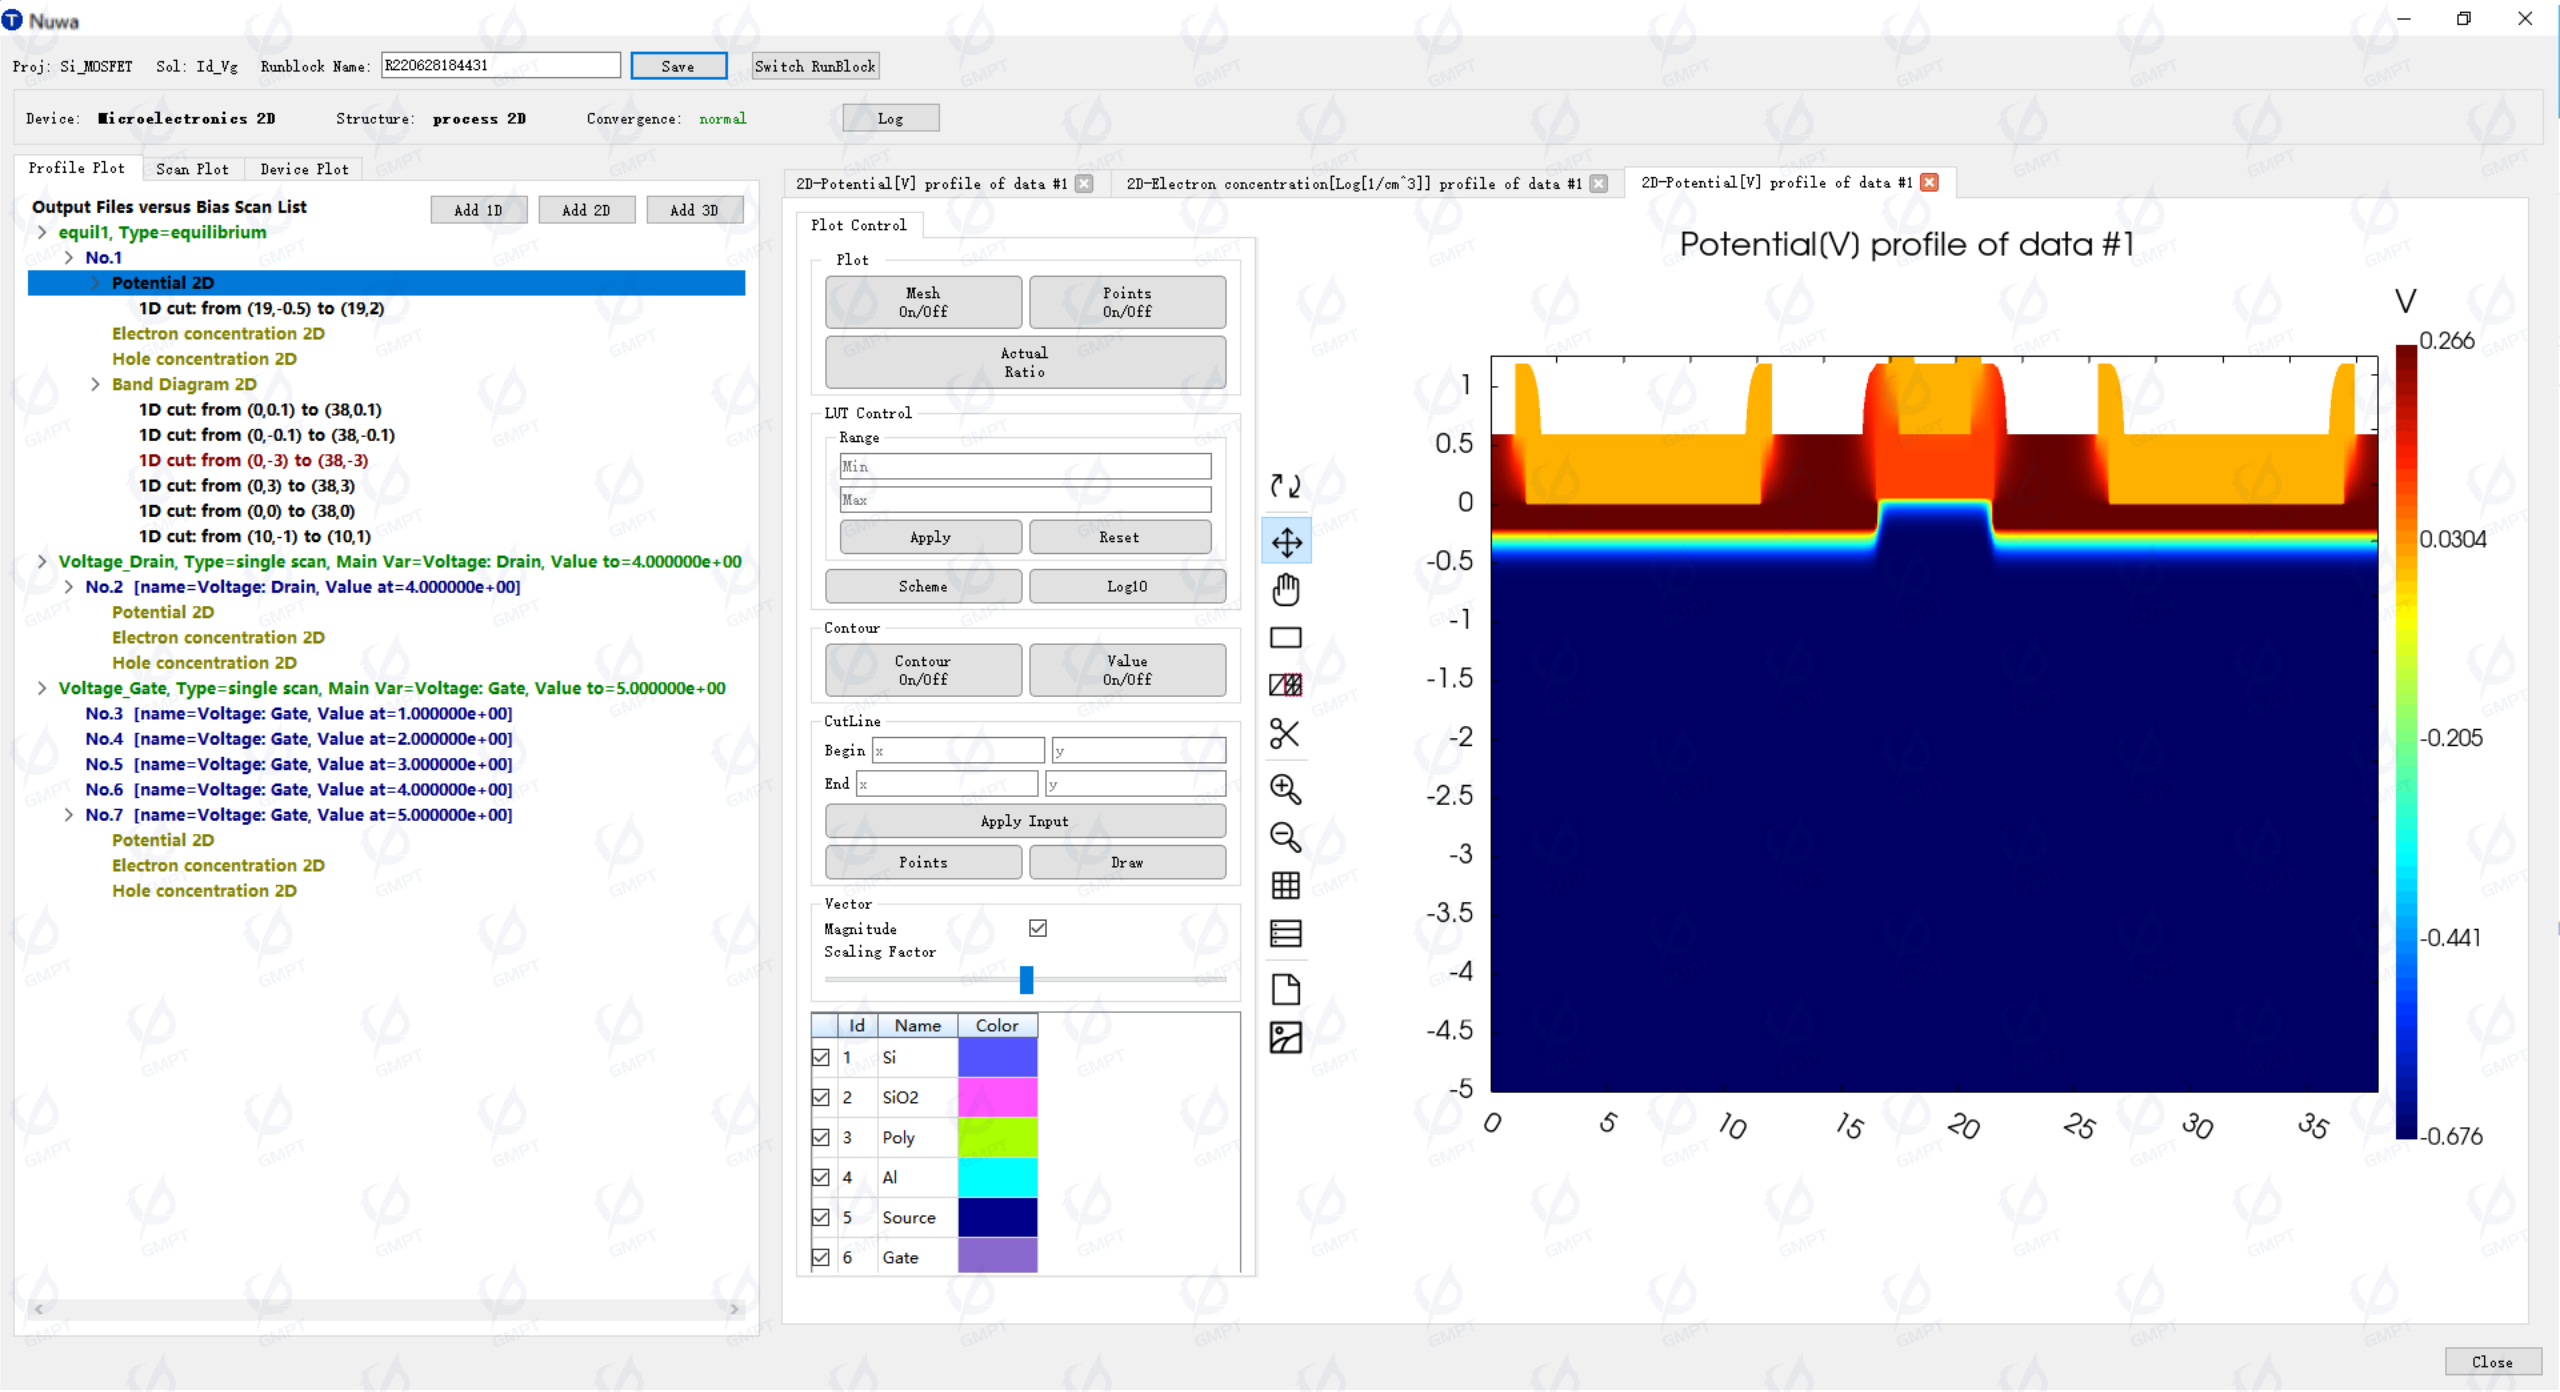
- Supports the display of 2D plots for internal distributions within the device, such as electron/hole concentrations, carrier mobility, electric field, potential, etc., and provides the ability to display 1D plots at any arbitrary tangent position.
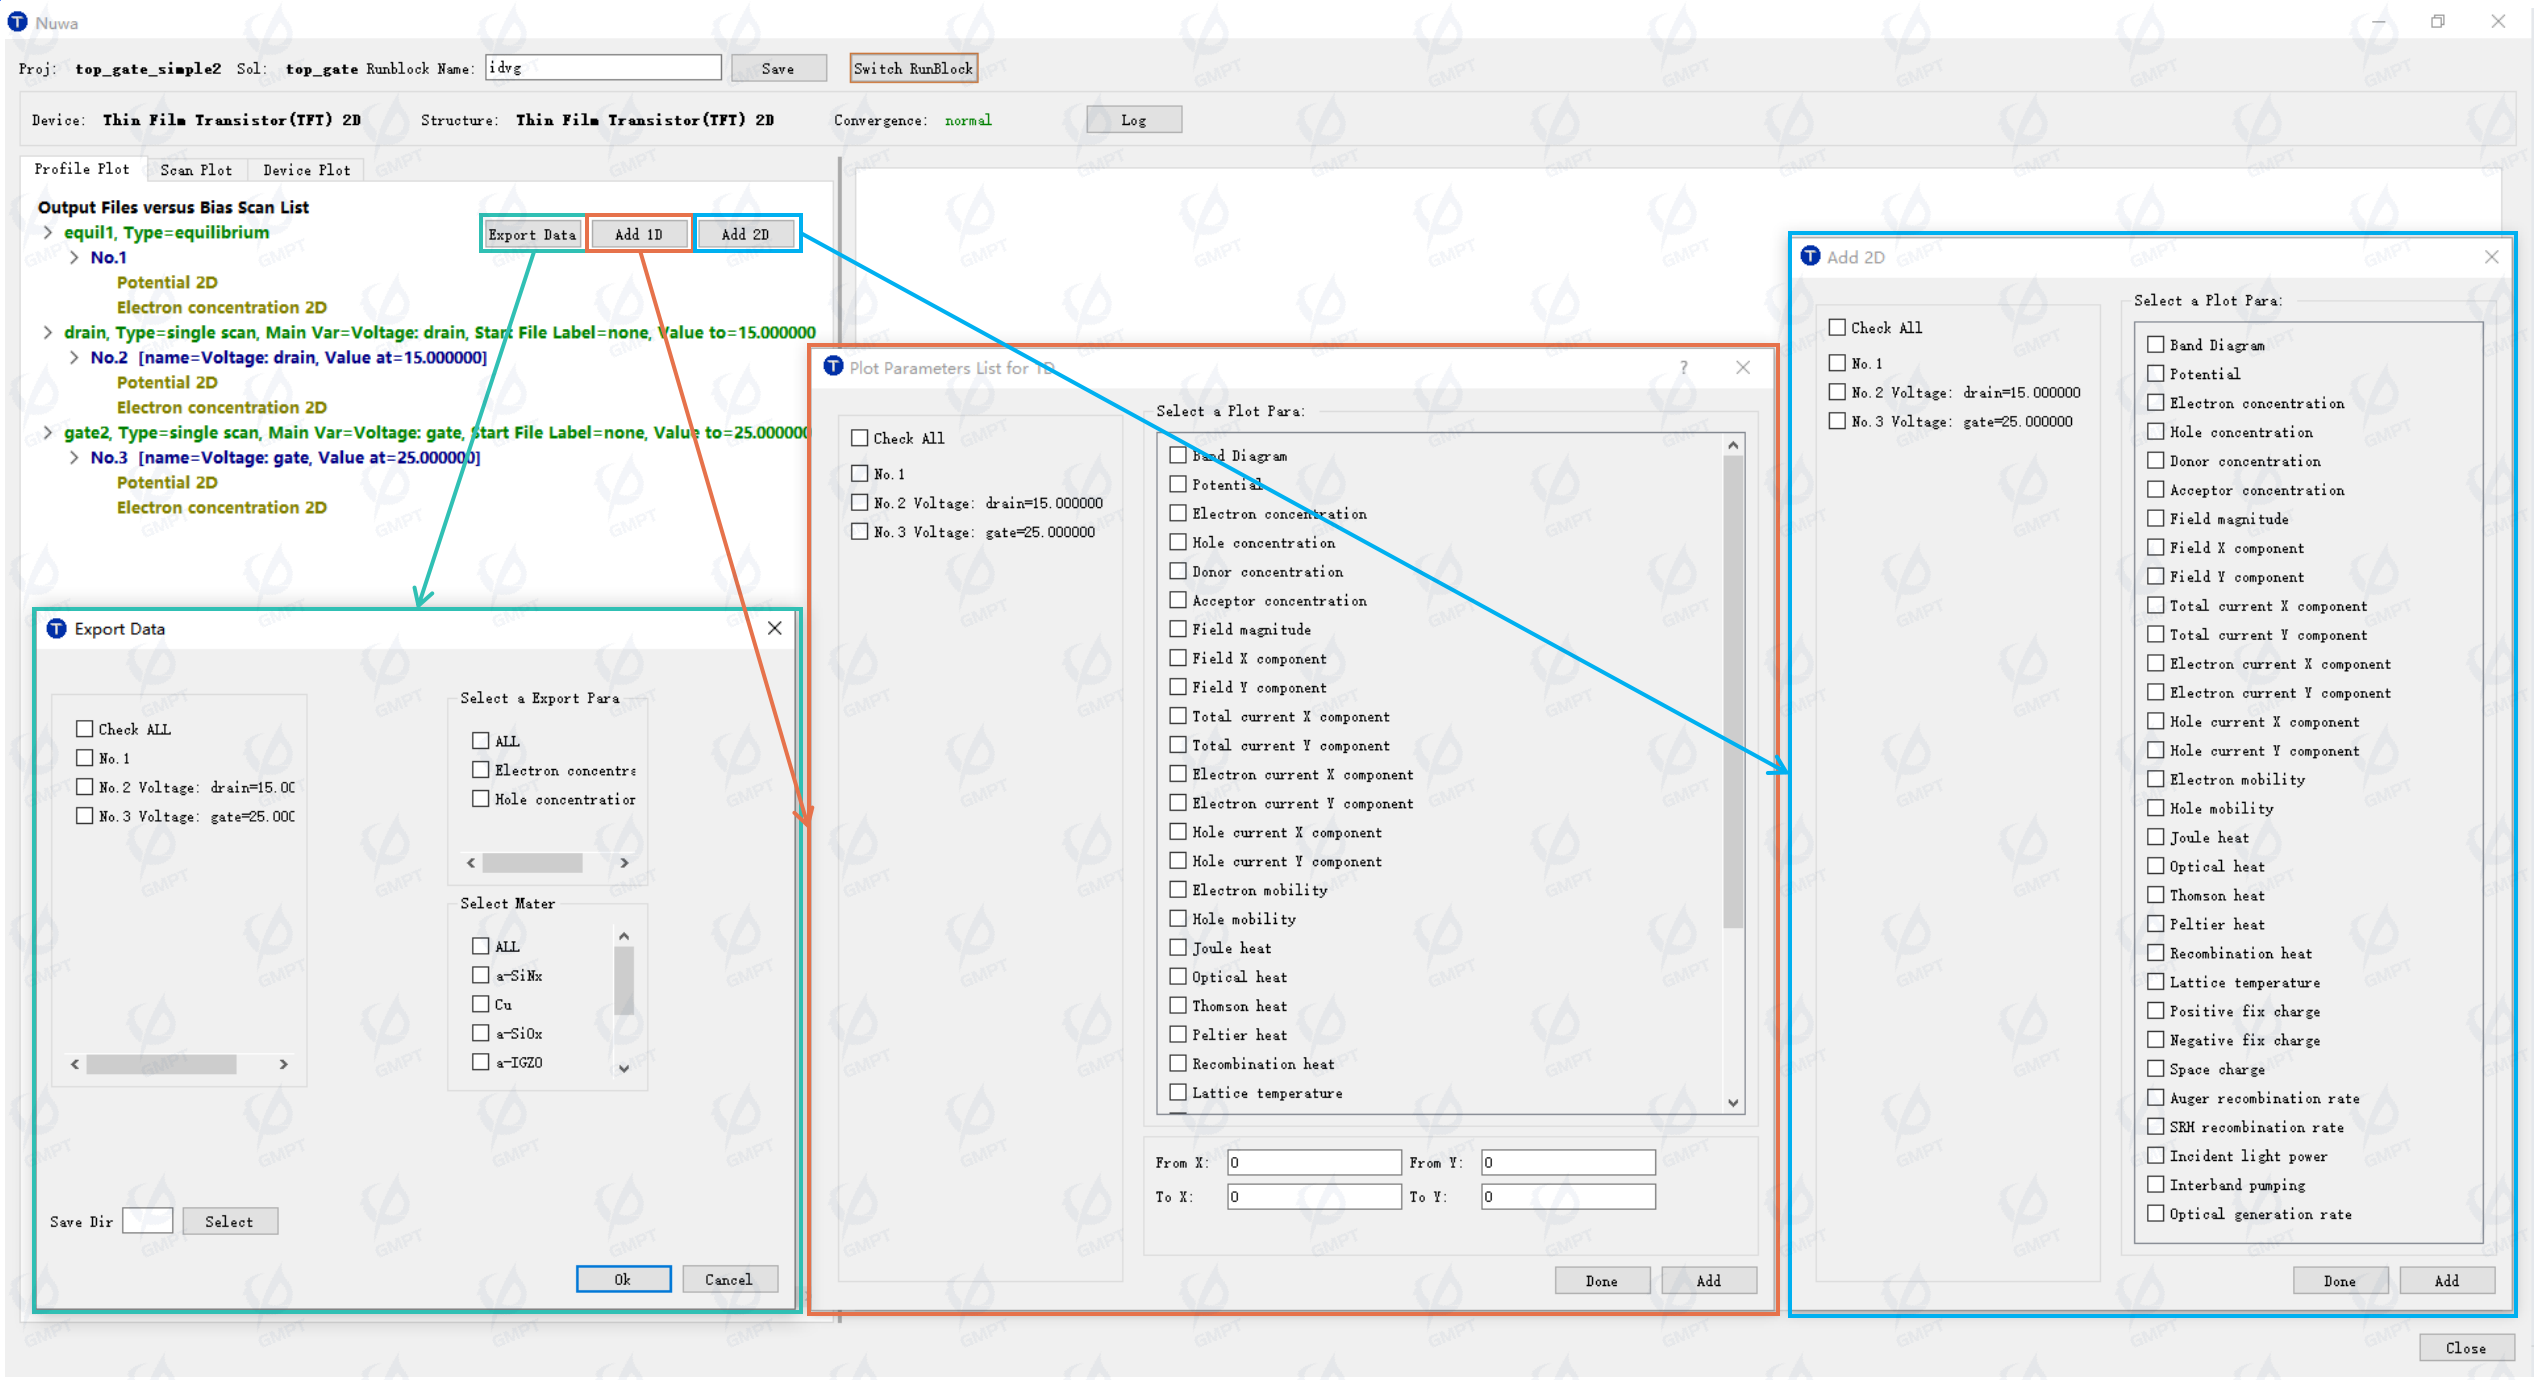
- Supports data processing, saving, and image saving for 2D and 1D plots.
- Supports exporting 2D distribution of physical quantities.
- Supports the display of 2D plots for internal distributions within the device, such as electron/hole concentrations, carrier mobility, electric field, potential, etc., and provides the ability to display 1D plots at any arbitrary tangent position.
Scan Plotting
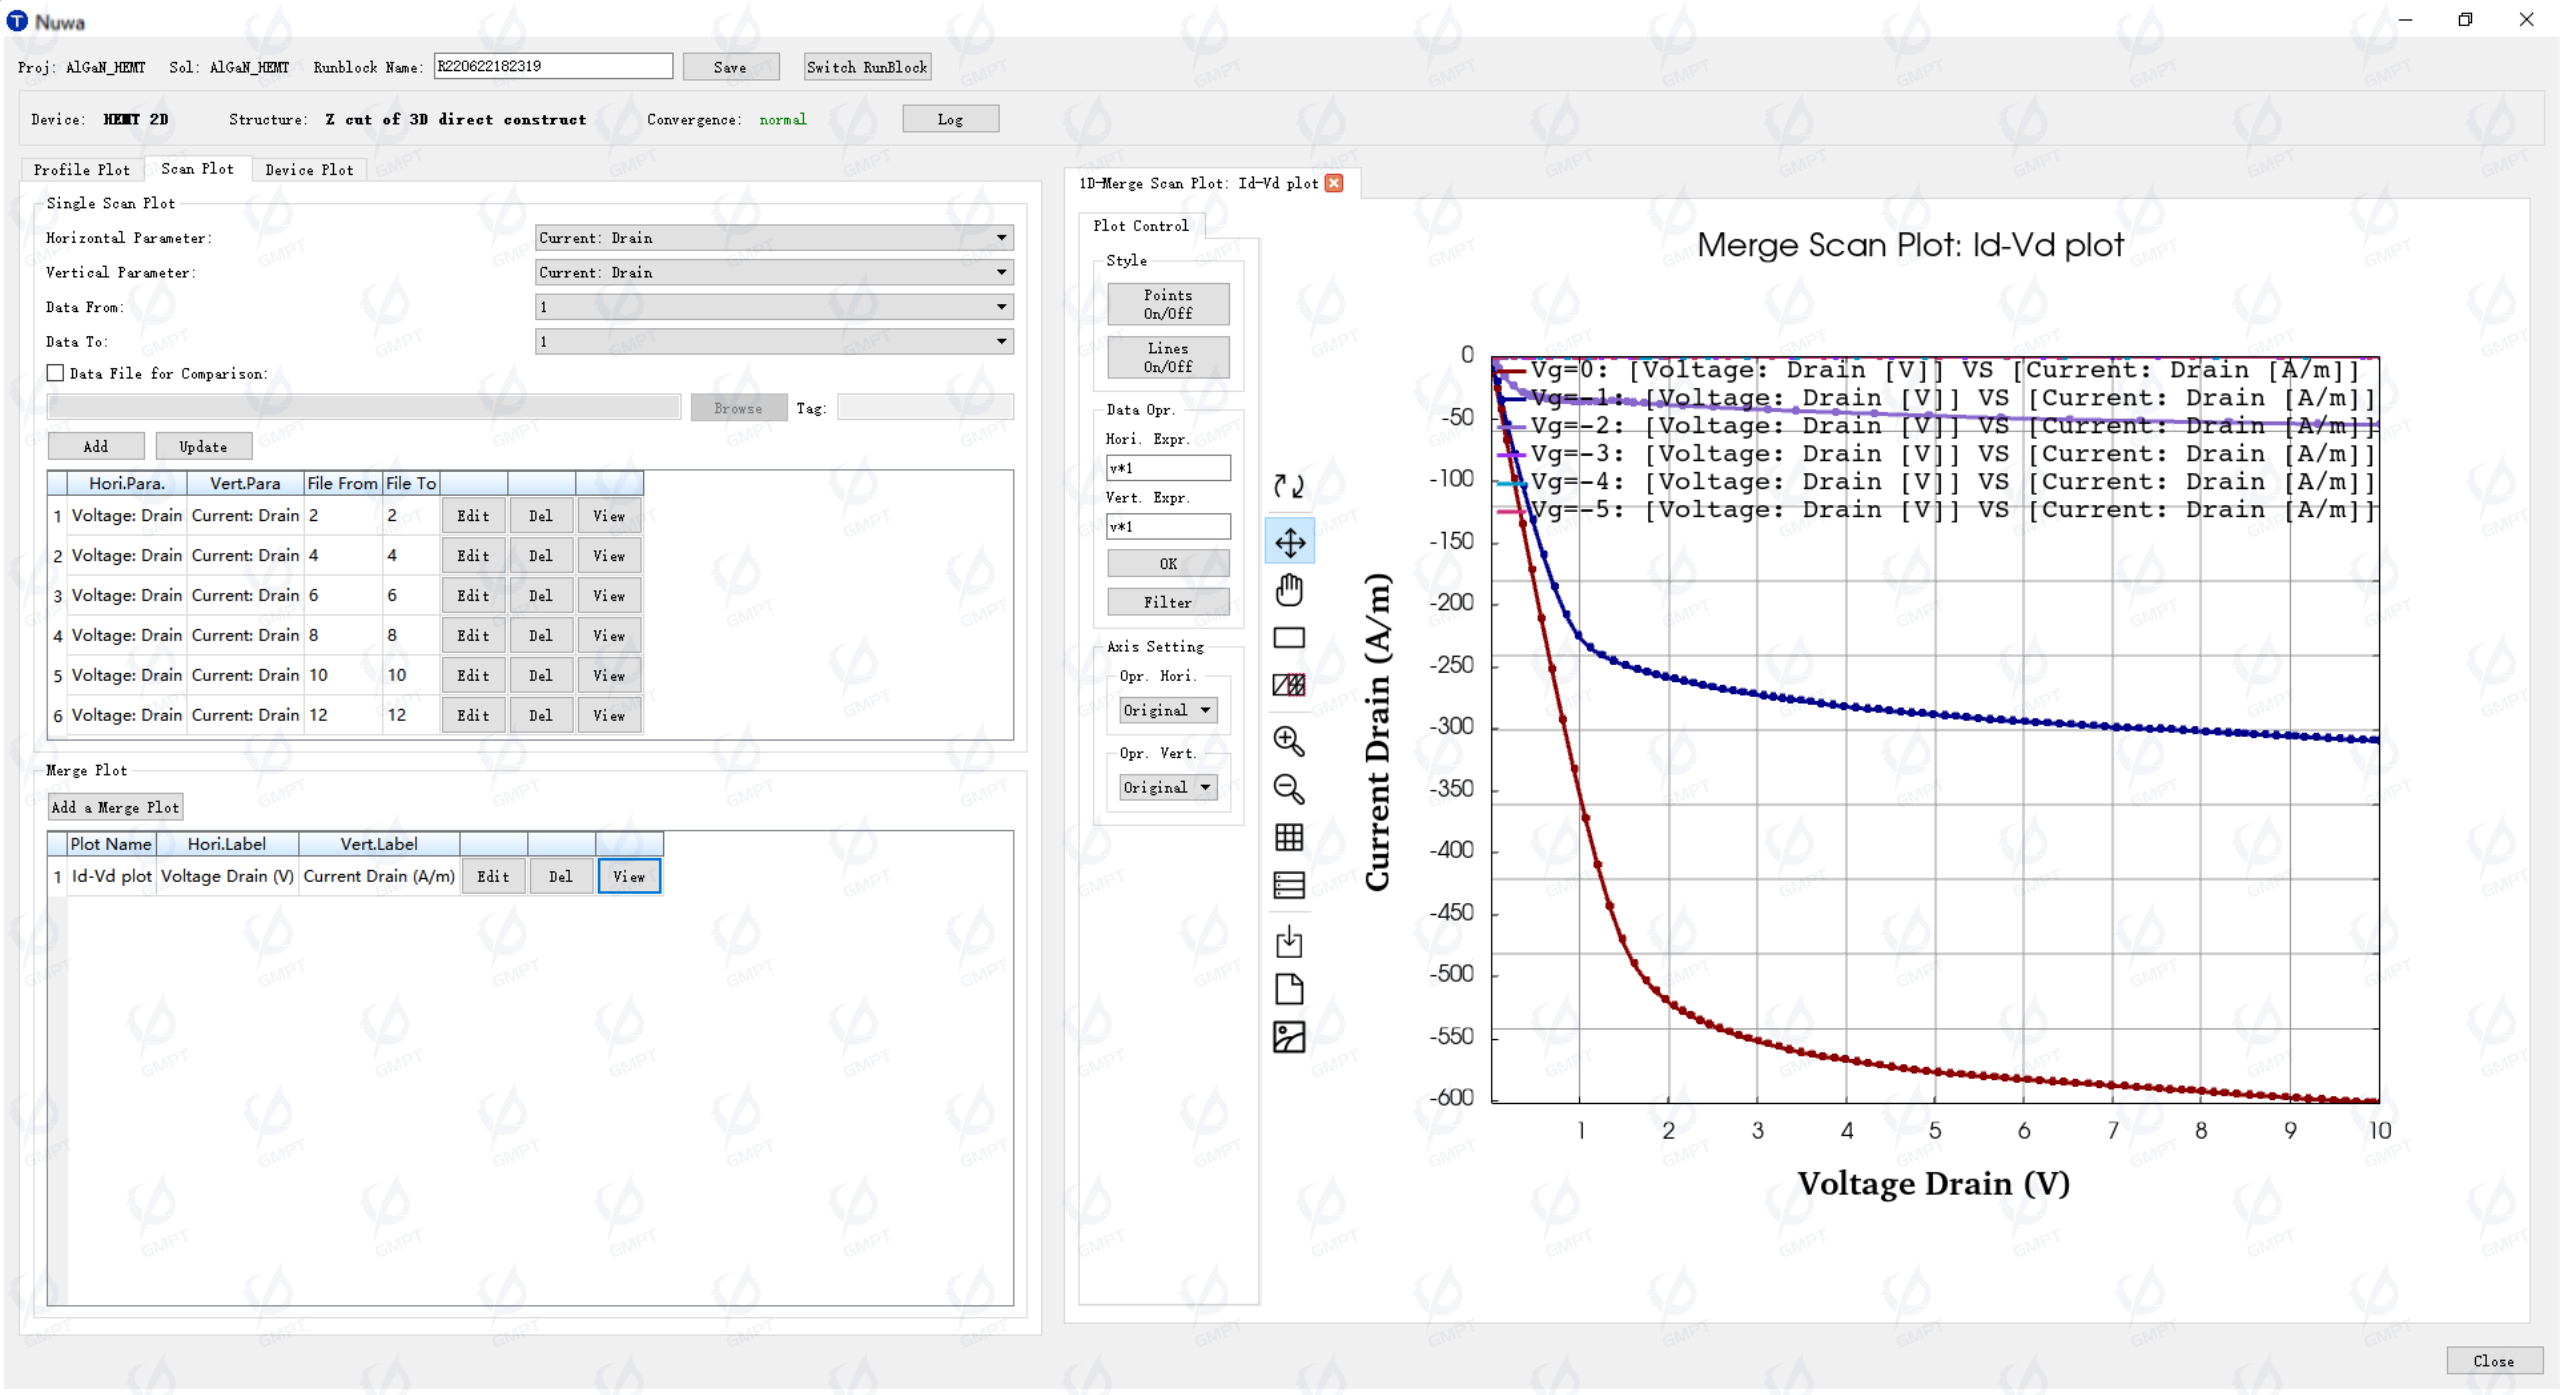
- Supports the display of scan curves of current, voltage, temperature, time, and other variables.
- Supports importing data and comparing it with scan data, as well as performing calculations on variables and flipping coordinate axes.
- Supports displaying multiple sets of scan curves simultaneously for comparison and analysis.
- Supports the display of scan curves of current, voltage, temperature, time, and other variables.
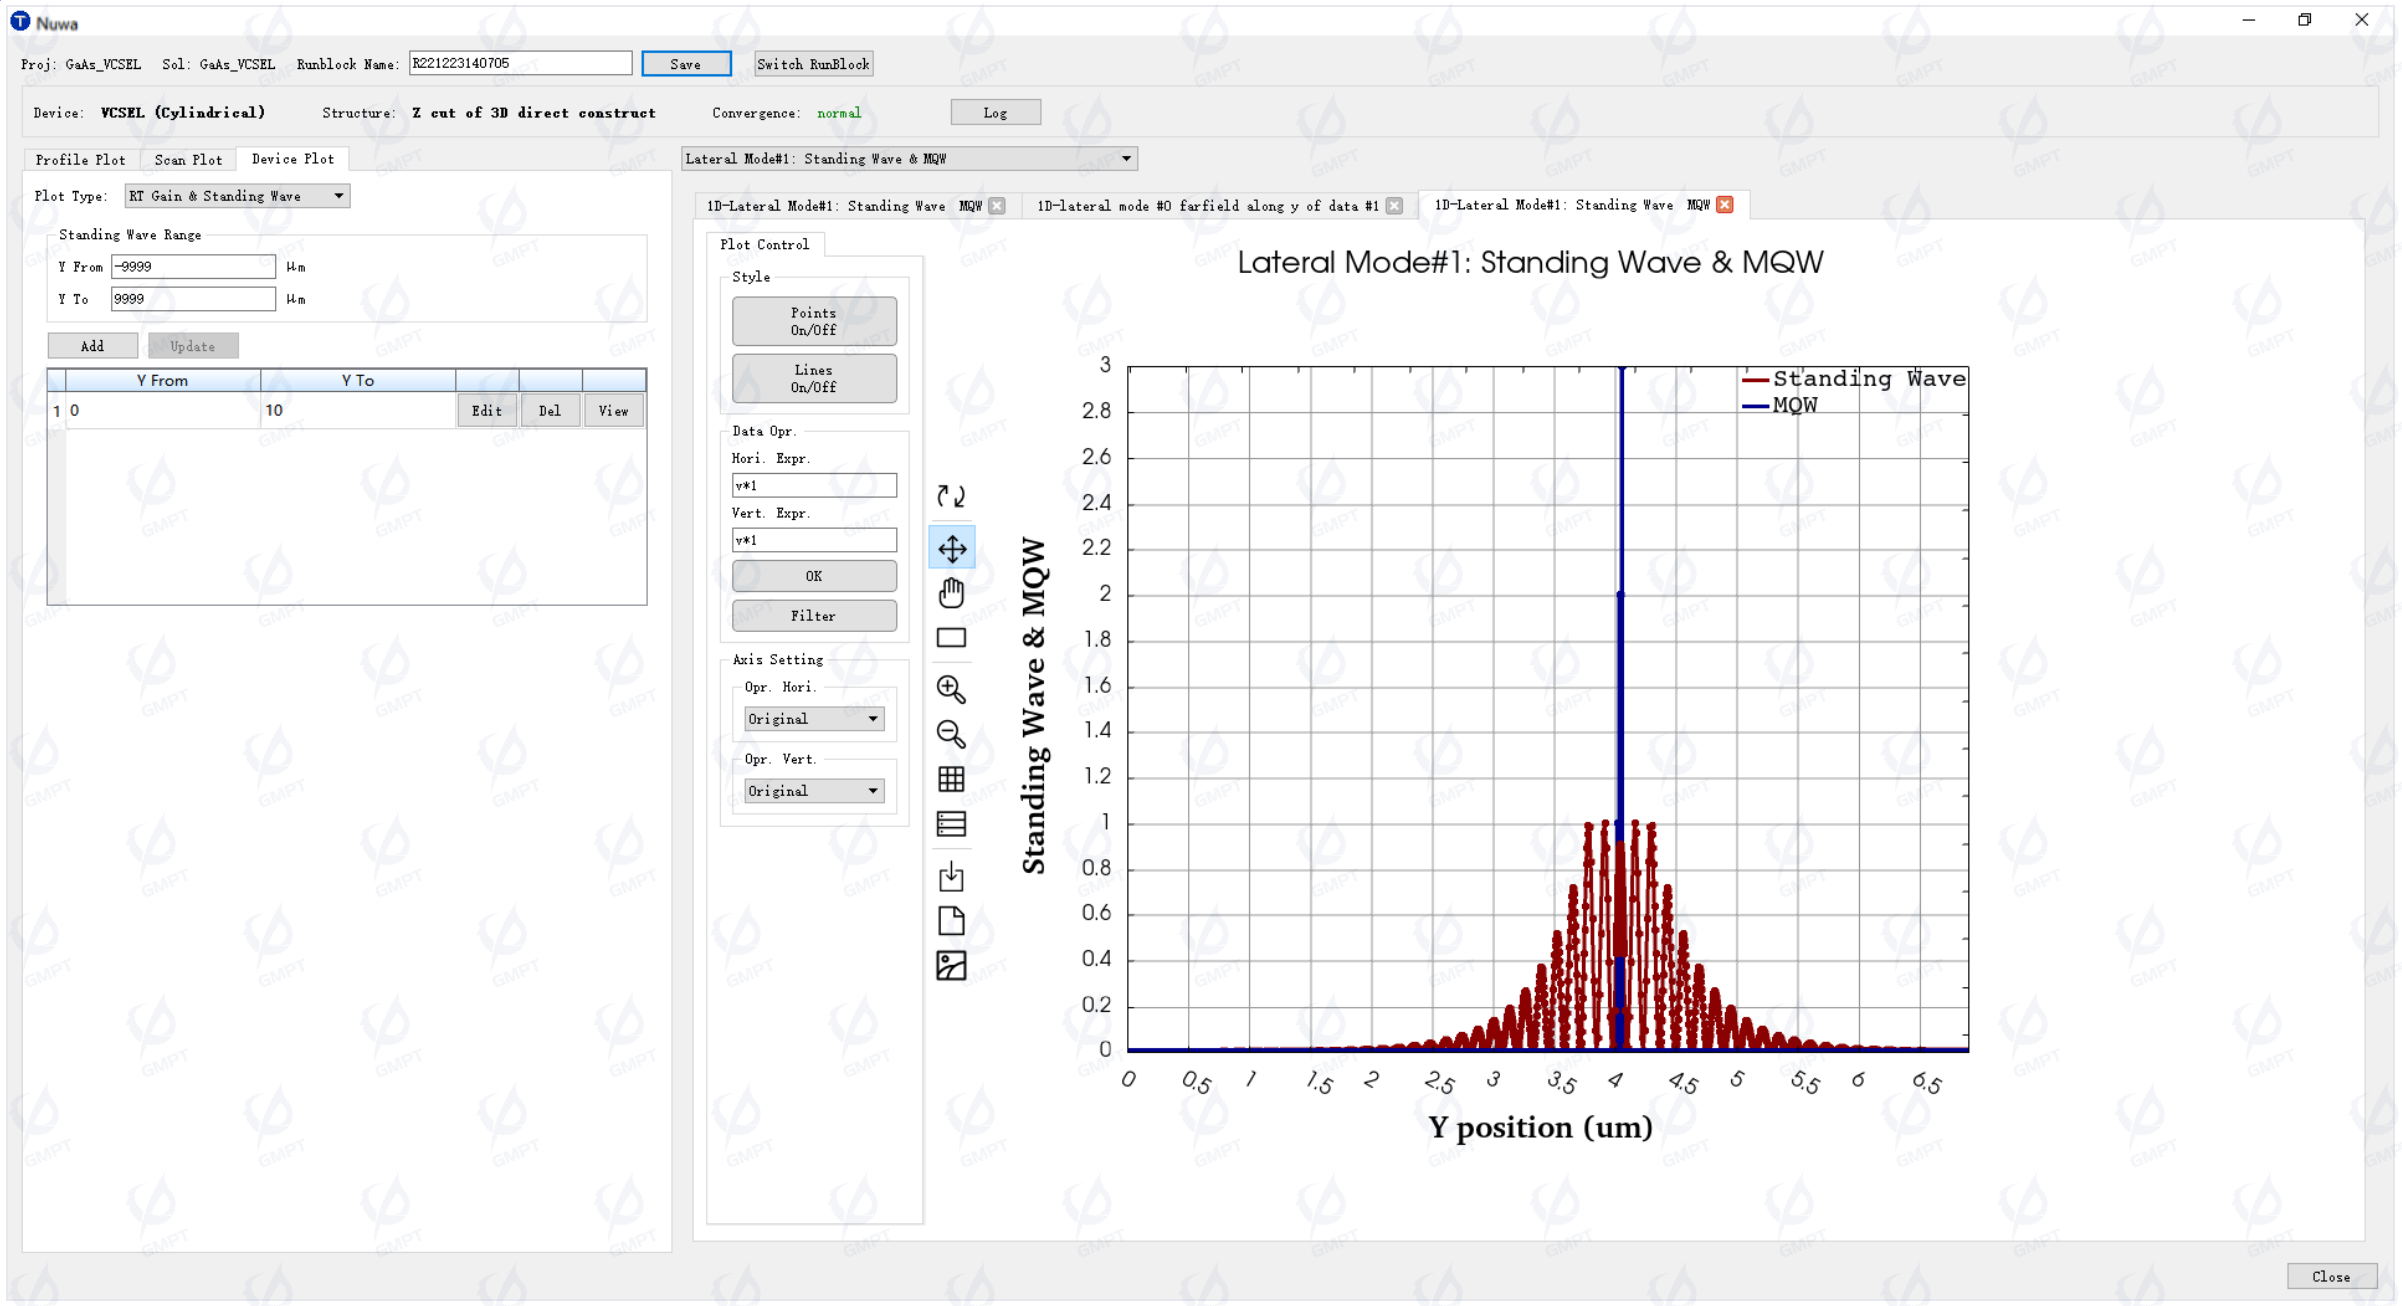
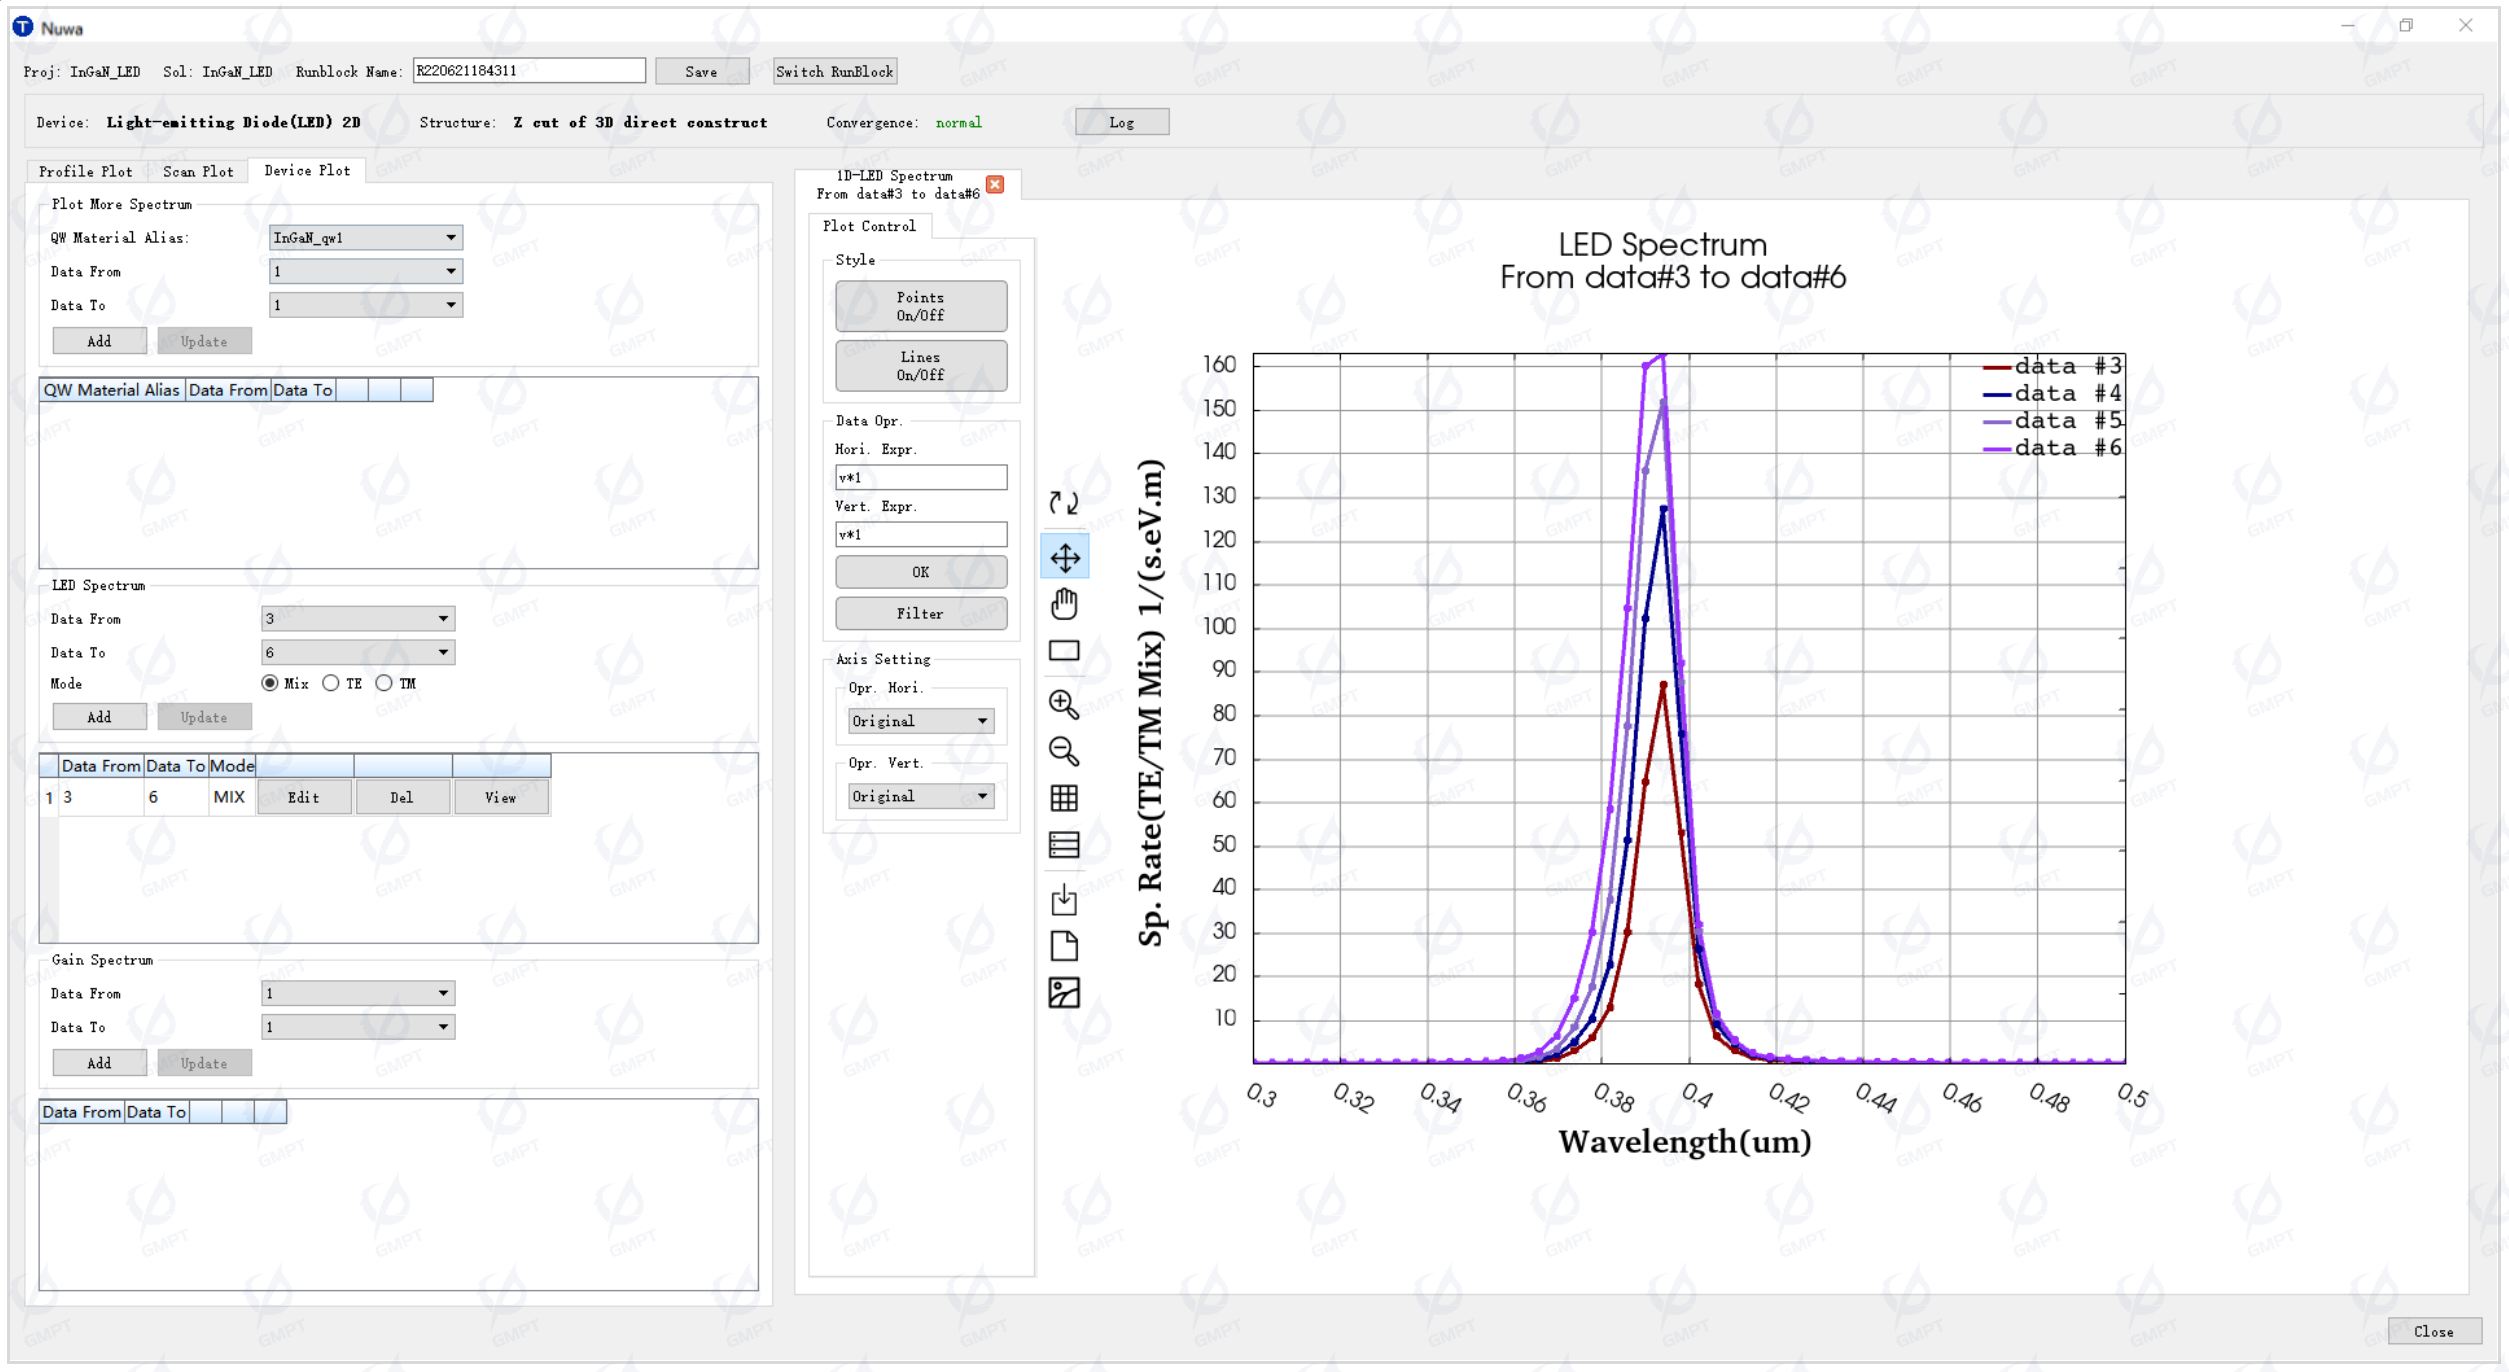
Device Characteristic Plotting
- Supports displaying output results of device characteristics categorized by device type.
- Supports displaying output results of device characteristics categorized by device type.